


Technical traders have been attempting to incorporate statistics with trading. Afterall, a trading edge based on technical analysis relies on probabilities. However, many attempts to do so often prove to be futile. One concept from statistics that shows some promise and has in fact been used by many traders is Linear Regression. This strategy shows us an example of an indicator which uses linear regression to help traders make sense of a price chart.
i-Regression Indicator
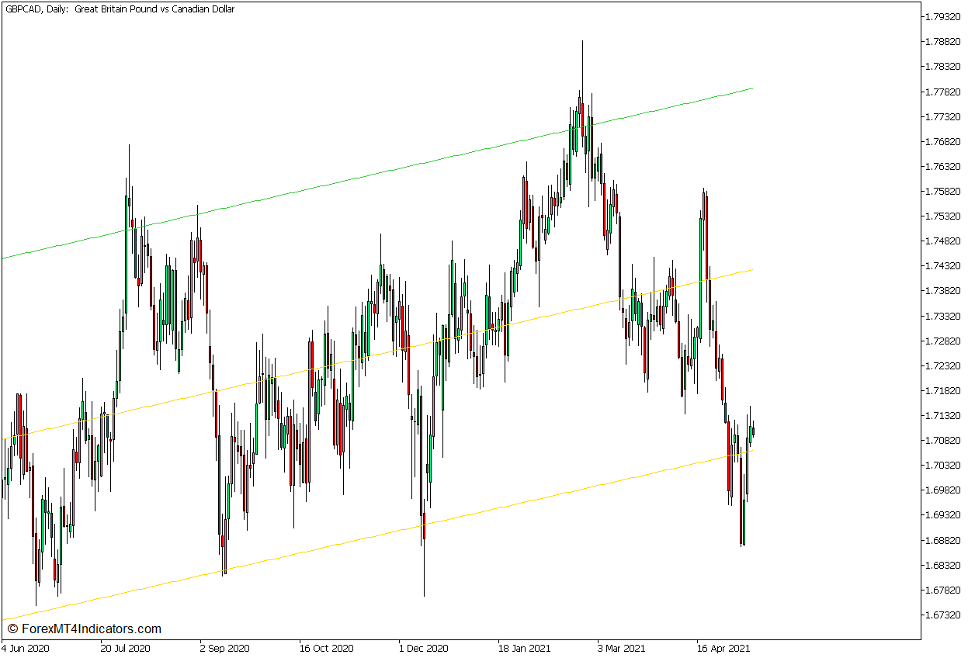
The i-Regression Indicator is a custom technical indicator which is based on a statistical concept called Linear Regression. Such use of linear regressions allows traders to identify price channels more easily.
This indicator was developed to automatically identify price channels using linear regression as a basis for plotting the range of the channel. It does this by using the concept of a Bell Curve. It then identifies the mean price based on the distribution of price. The next step that its algorithm does is to use standard deviations in order to calculate for the outer limits of the range such that a certain percentage of the price points fall within the range. For example, a standard deviation of two approximates that about 95% of the price data points fall within the range of the channel.
The i-Regression Indicator has three settings which modifies how the indicator plots the channel. The first type of channel that it plots is a basic linear regression channel. It plots three straight lines. The middle line represents the mean price or the median of the range. The upper and lower lines represent the upper and lower extremes of the price range which would allow the indicator to cover approximately 95% of the price points within the price channel.
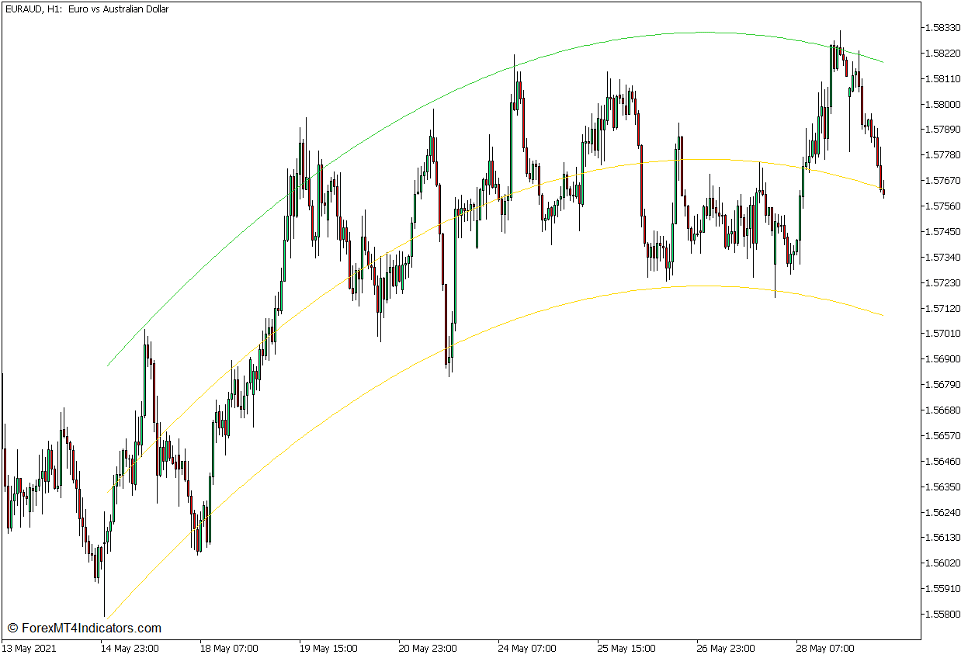
The next type of channel that it plots is a parabolic type of channel. It uses a formula which causes the indicator to plot a channel that would bend once. This allows users to easily identify the change of the trajectory of price action.
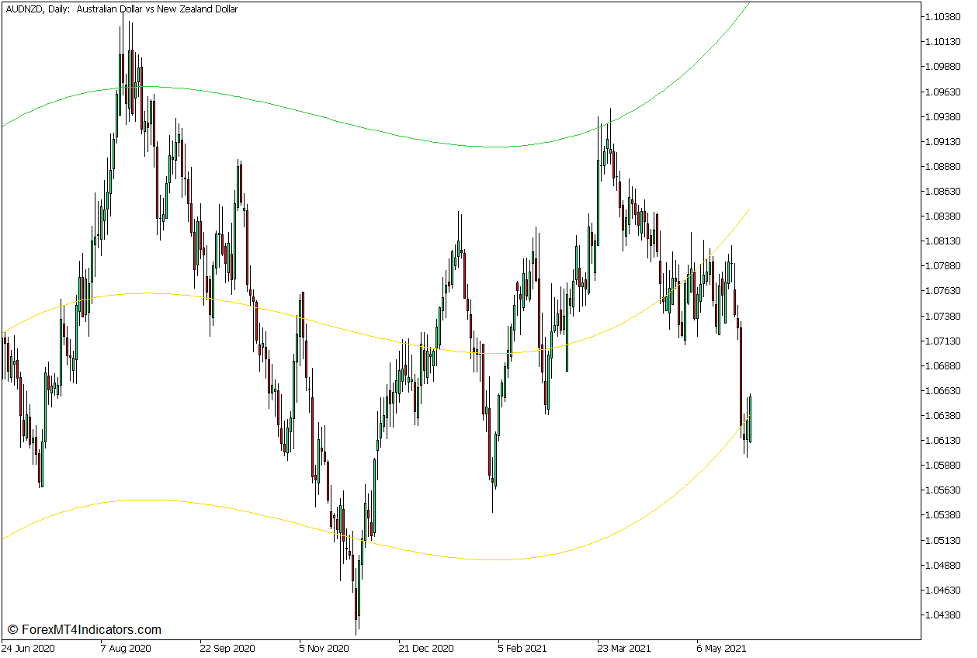
The last type of channel that this indicator plots is one which uses a cubic formula. This allows the indicator to plot a channel that would bend on two points. This allows for a more precise identification of the trajectory of price action.
Pin Bar Candles and Price Rejection
Candlestick patterns are probably one of the rawest and most immediate signals that traders can use. This is because candlestick patterns tell a story which would indicate the direction that the market may take. Reversal candlestick patterns in particular are telltale signs of price rejection and a probable momentum reversal.
The Pin Bar pattern is probably one of the most basic yet effective momentum reversal candlestick patterns that traders may use. It is a simple candlestick pattern composed of just one candle. It is identified as a candle with a distinguishably small body with a long wick on one end and a small wick on the opposite end. Its direction may be identified based on the where the long wick is in relation to its body. If the long wick is below its body, the candle would be identified as a bullish pin bar candle. On the other hand, if the long wick is above its body, then the candle is indicating a probable bearish reversal.
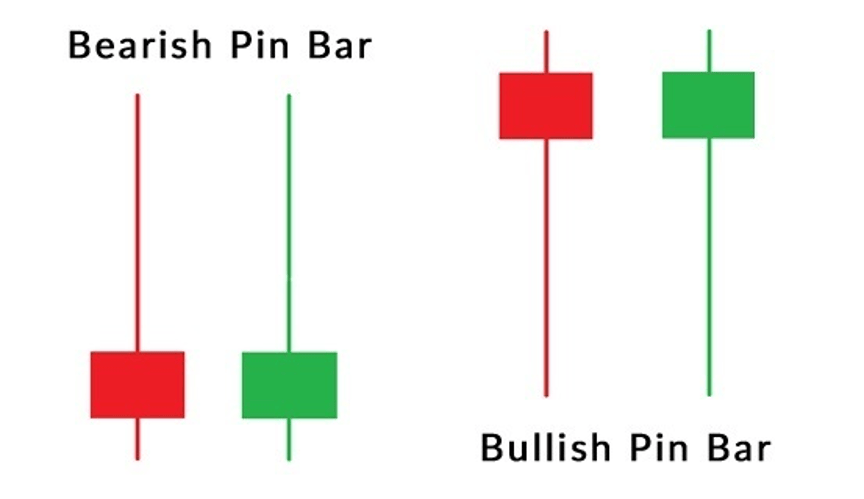
The Pin Bar pattern is a telltale sign of a probable momentum reversal because it tells us a story of price rejection. It tells us that the market is uncomfortable with a certain price level and thus the market would quickly reject it, which is why the market would quickly recover against its high or low and close near the opposite end, resulting in a candle with a long wick and a small body.
Trading Strategy Concept
i-Regression Parabolic Median Break Forex Trading Strategy for MT5 is a simple channel based trading strategy which provides trade signals as price crosses over the mean of the channel. It uses the i-Regression Indicator to help traders objectively identify the price channel. In particular, we would be using the parabolic type of channel. This allows us to observe the direction of price action, as well as the trajectory of the trend.
The first criteria which should be met is a strong crossover between price and the middle line of the parabolic i-Regression channel. This indicates a shift in the direction of momentum. However, we will not be trading solely based on the crossover between price and the median of the channel. We will allow price to pull back towards the middle line. We would then observe for signs of price rejection on the area around the middle line. This would be identified by a pin bar candle pushing against the middle line of the channel.
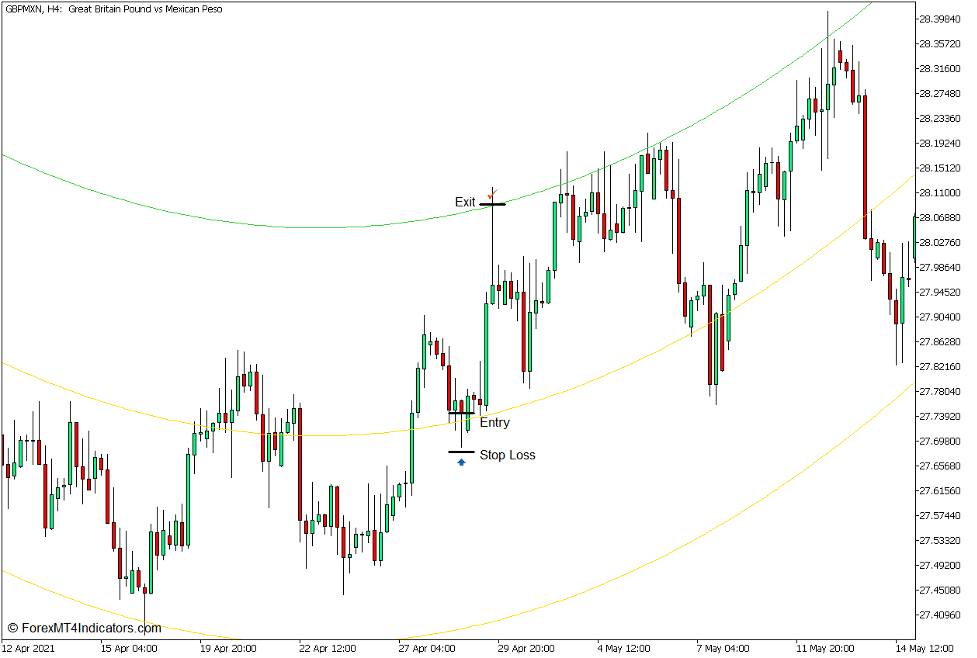
Buy Trade Setup
Entry
- Price should cross above the middle line of the i-Regression channel with strong momentum.
- Allow price to pullback towards the middle line of the channel.
- Open a buy order as soon as a bullish pin bar candle is identified indicating a price rejection of the area.
Stop Loss
- Set the stop loss below the entry candle.
Exit
- Close the trade as soon as price touches the upper line of the i-Regression channel.
Sell Trade Setup
Entry
- Price should cross below the middle line of the i-Regression channel with strong momentum.
- Allow price to pullback towards the middle line of the channel.
- Open a sell order as soon as a bearish pin bar candle is identified indicating a price rejection of the area.
Stop Loss
- Set the stop loss above the entry candle.
Exit
- Close the trade as soon as price touches the lower line of the i-Regression channel.

Conclusion
Channel based trading is one of the most basic trading strategies that traders may use. Most traders would do this by plotting trendlines based on price action. However, this method may be subjective. On the other hand, the strategy mentioned above allows traders to identify the channels objectively using the i-Regression Indicator.
One variation of this strategy would be to trade on price rejections forming on either the upper or lower line of the channel. This may allow for higher yields based on risk-reward.
Traders who would use this strategy should learn to read price action as it is the fundamental basis of the trade signals.
Recommended MT5 Brokers
XM Broker
- Free $50 To Start Trading Instantly! (Withdraw-able Profit)
- Deposit Bonus up to $5,000
- Unlimited Loyalty Program
- Award Winning Forex Broker
- Additional Exclusive Bonuses Throughout The Year

>> Sign Up for XM Broker Account here <<
FBS Broker
- Trade 100 Bonus: Free $100 to kickstart your trading journey!
- 100% Deposit Bonus: Double your deposit up to $10,000 and trade with enhanced capital.
- Leverage up to 1:3000: Maximizing potential profits with one of the highest leverage options available.
- ‘Best Customer Service Broker Asia’ Award: Recognized excellence in customer support and service.
- Seasonal Promotions: Enjoy a variety of exclusive bonuses and promotional offers all year round.

>> Sign Up for FBS Broker Account here <<
Click here below to download: