


Double Tag Overextended Forex Trading Strategy
Mean reversals strategies are one of the main types of strategies among technical traders. Most trading strategies either are some type of trend following strategy or a mean reversal strategy.
Mean reversal is basically the reversal of price going back to its average or mean. Think of it as a rubber band. Price could pull away from its mean during trending markets and stay away from it for quite some time. But sooner or later price would have to come back to some sort of average. This is because most sensible people are price sensitive. They wouldn’t want to buy something which they think is already too expensive or sell something at a very low price.
This concept is very logical in a real-world market scenario. However, in the trading world, greed often clouds the minds of traders making them insensitive to price excesses. This is also probably because traders usually just look at a chart and are in it for the money. They don’t buy things because of the intrinsic value but for the profit. Because traders take into account any intrinsic value of what they are trading and are only looking at price and what it could be in the future, traders tend to chase price instead of being rational and trying to assess whether the asset’s price is already either too expensive to buy or too cheap to sell.
However, as the bulk of the market wises up and sees price being on an excess, traders start taking counter-trend trades, bringing price back to the mean. This reversal during an overextended market condition is what mean reversal is and strategies built around this concept, when thought of carefully and tested, are very sound and logical.
Identifying Overextended Market Conditions
There are many different ways to identify overextended market conditions. It even varies between traders, depending on their strategy, the timeframe they trade in, the length of time they hold positions, and the type of trader that they are. But as retail traders, we are usually constrained with technical analysis, being that research based fundamental analysis is usually out of our reach.
Since as retail traders, we usually use technical analysis or charts to analyze the market, let’s explore some technical indicators that could help us identify these overbought or oversold market conditions.
Oscillators versus Bands and Channels
There are two types of technical indicators that could allow us to visually and quantifiably determine if a market is oversold or overbought. These are the oscillator type of indicators and most indicators that have bands or channels incorporated on it.
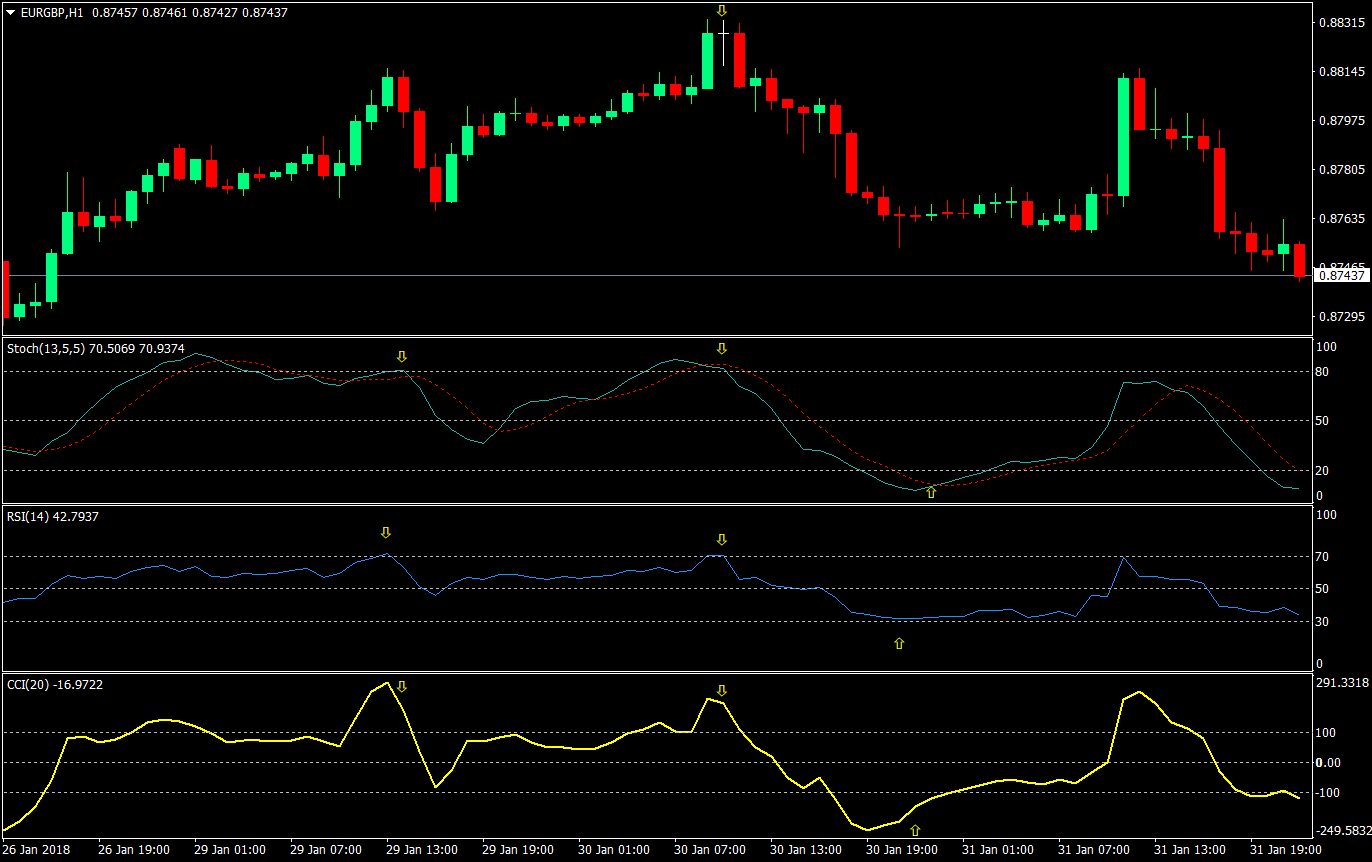
First, the oscillators. Oscillators type of indicators are great because it allows traders to see how far price is from the middle line, usually either a zero or a 50 line. This middle line is basically the mean. However, not all oscillators could effectively identify overbought or oversold market conditions. This is because some oscillators are not range bound. This means figures could soar off the roof or drop too far below and you wouldn’t have any way of qualifying it as oversold or overbought. An example of this is the MACD. MACDs are great but they can’t identify oversold or overbought conditions because it is not range bound. The market could turn at a far different overbought condition compared to the previous overbought reversal point. What we need are oscillators that are range bound and has levels marking overbought or oversold conditions. These are your Stochastics, Relative Strength Index (RSI), Commodity Channel Index (CCI), etc. Although the overbought and oversold markers are at different levels, they tend to the same thing, with some variations depending on the parameters used.
Next stop, the bands and channels. These types of indicators also do tend to show overbought and oversold market conditions. The way they do it however is a little different. Bands and channels are usually printed on the price chart itself, with lines tracking the mean and outer lines marking the extremes. These are your Bollinger Bands, Keltner Channels, and the likes.
The advantage of bands and channels though is that because the overbought and oversold conditions are marked on the price chart, the outer bands and even midlines also serve as supports and resistances, which at times visually shows how price rejects the area near the bands.
Strategy Concept
Individually, oscillators and bands are great. However, when used in conjunction with each other, you would be able to identify confluences. This could give us a higher probability trades due to the fact that more than two indicators have already quantifiable and visually confirmed that price is overextended. For this strategy we will be using the Stochastic Oscillator and the Bollinger Bands.
But we won’t stop there. To further improve the likelihood of the trade working out for us, we will have another confirmation. This would be the reversal candlestick patterns. Any high probability reversal candlestick pattern would do. I usually prefer the pinbars and engulfing candles, but other patterns such as hanging man and piercing candles would also do.
Buy Trade Setup
Entry
- Stochastic Oscillator: both oscillator lines should be below 20
- Stochastic Oscillator: the fast stochastic oscillator should cross above the slow stochastic oscillator
- Bollinger Bands: price candles should be below or touching the lower outer Bollinger Band
- A bullish reversal pattern should appear
Stop Loss
- Set the stop loss at the low of the candle
Take Profit
- Set the take profit target at 2x the risk on the stop loss
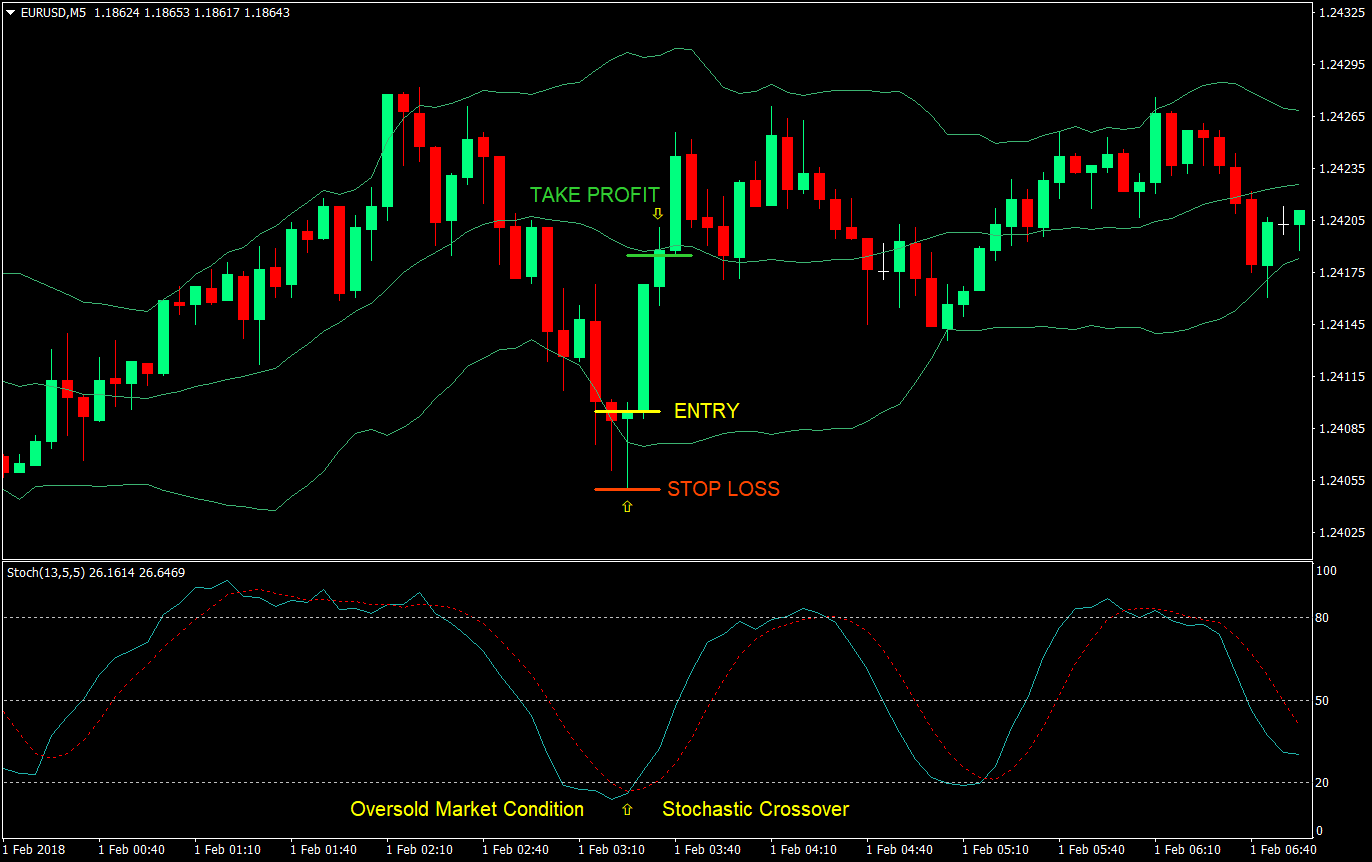
On this buy setup, the Stochastic lines crossed each other below the 20 level, confirming a reversal on an oversold market condition. This also coincides with a bullish pinbar appearing on the lower outer band of the Bollinger Bands. This indicates price below the outer band, which is an oversold area, is being rejected by the market. The entry is at the close of the pinbar candle and the profit target was easily hit in two candles after a strong reversal.
Sell Trade Setup
Entry
- Stochastic Oscillator: both oscillator lines should be above 80
- Stochastic Oscillator: the fast stochastic oscillator should cross below the slow stochastic oscillator
- Bollinger Bands: price candles should be above or touching the upper outer Bollinger Band
- A bearish reversal pattern should appear
Stop Loss
- Set the stop loss at the high of the candle
Take Profit
- Set the take profit target at 2x the risk on the stop loss
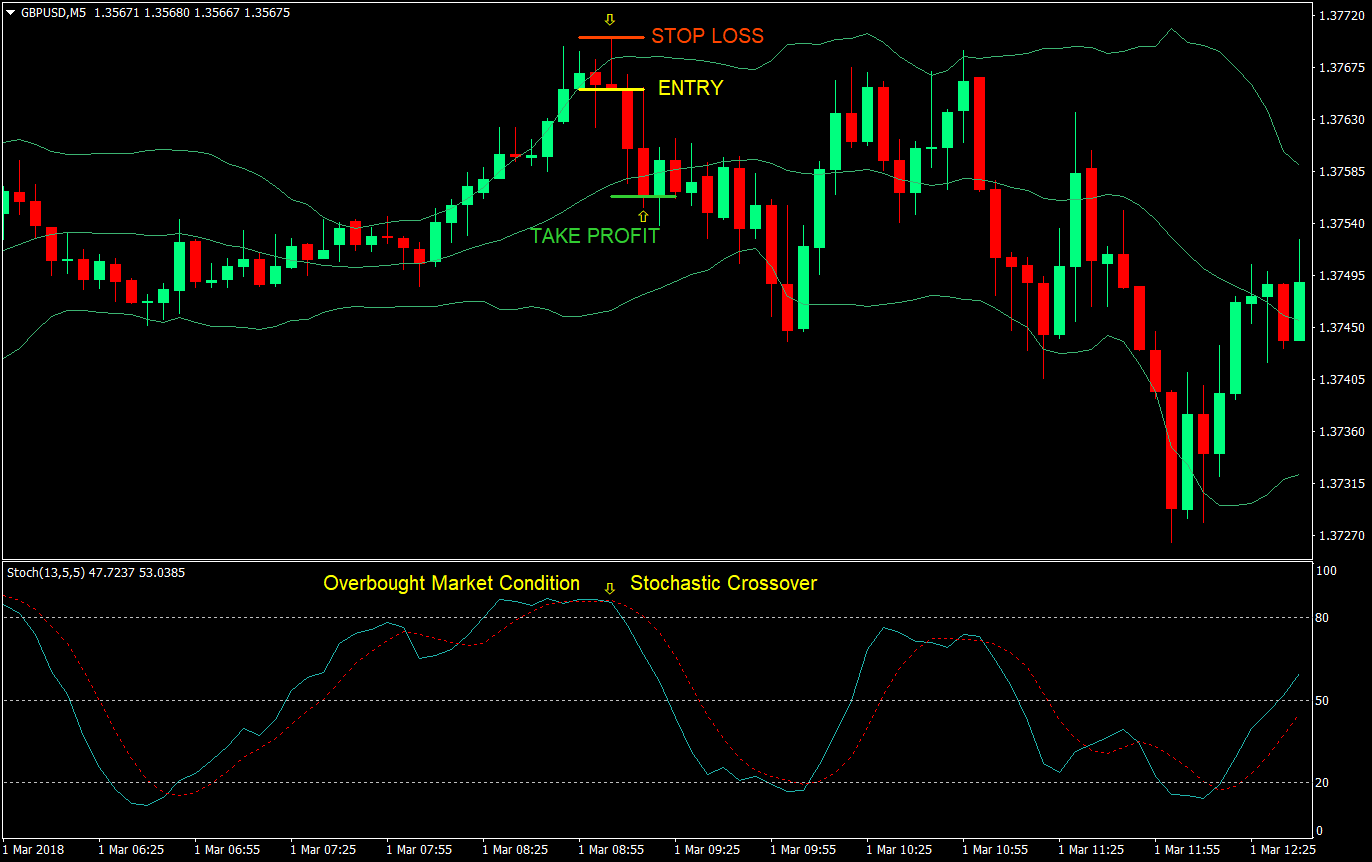
On this sample chart, we take a look at a bearish pinbar pattern rejecting the upper outer band. This price rejection of an overbought area also coincides with the crossover of the stochastic lines above the 80 line. Again, the take profit target was reached in two candles.
However, this isn’t the only trade setup on this chart. If you would notice several candles after this setup, the stochastics crossed over on the 20 level, while price was touching the lower outer band. Interestingly, though the candlestick pattern is not that pretty, it still qualifies as a bullish engulfing pattern. This possible buy setup would also have been for a profit.
Conclusion
Mean reversals and price rejections of oversold and overbought market scenarios are excellent entry points. However, catching the actual turning point is quite difficult to do.
Having two indicators identify an oversold or overbought condition increases the pressure of a reversal. However, this should not be the only qualification for an entry because trends could continue, and overextended market conditions could go on for several periods. By waiting for a reversal candle to appear we could identify a high probability turning point for a mean reversal setup.
Recommended MT4 Broker
- Free $50 To Start Trading Instantly! (Withdrawable Profit)
- Deposit Bonus up to $5,000
- Unlimited Loyalty Program
- Award Winning Forex Broker
- Additional Exclusive Bonuses Throughout The Year

>> Claim Your $50 Bonus Here <<
Click here below to download: