


DeMarker Divergence Forex Strategy
Oscillating indicators have their own strengths and weaknesses. Some indicators excel in assessing the market’s long-term trend, some with the short-term trend. Some indicators have a dynamic range, others have a fixed range. Some indicators are easy to use for divergences, others are hard to use with divergences.
The DeMarker indicator also has its own pros and cons. One of its pros is that it is very reactive to price movements allowing it to have jagged peaks and valleys. Another is that it is based on a fixed range of zero to one, allowing it to have a fixed overbought and oversold levels. But unlike the stochastic indicator, the DeMarker indicator doesn’t swing too rapidly between the overbought and oversold areas.
Because of these characteristics, the DeMarker indicator is an excellent indicator to use for divergences. The overbought and oversold indicators allow for easy filtering of peaks and valleys that we could consider for a divergence trade setup. Also, its jagged peaks and valleys make it easier to pinpoint where the divergences are.
Its disadvantage however is that because of its reactiveness to price, a trader not used with the DeMarker indicator may be shaken off a trade easily if the indicator whipsaws a bit.
The Divergences
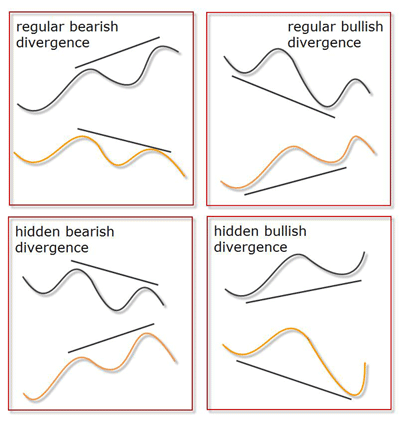
Divergences are basically disagreements between the oscillation of price on the actual chart and the oscillation of an indicator. This is determined by the highs and lows of the price action and the oscillating indicator.
For example, if a price forms a higher-high but the indicator forms a lower-high, that would be considered a divergence, specifically a regular bearish divergence.
If price forms a lower-high but the indicator forms a higher-high, that would be hidden bearish divergence.
A chart with prices forming lower-low and an indicator forming a higher-low would be a regular bullish divergence.
And lastly, if price forms a higher-low while the indicator forms a lower-low, that would be a hidden bullish divergence.
To make things easier to visualize, we will provide you with a chart below.
Divergences are powerful tools in trading as it effectively indicates a probable rapid price reversal. This is because since the price and the indicator disagrees for a moment, which forces one to follow the other.
The Trade Setups – Entries, Stop-Losses and Exits
Peaks and valleys going beyond the overbought and oversold areas will be the target areas for divergences. Although there may be divergences within the normal areas, but these areas don’t produce high probability divergences, so we will filter these out.
As soon as a divergence is detected, the trade should be taken on the close of the candle. Since the DeMarker indicator has a fixed range, the peaks and valleys when connected usually forms a horizontal line instead of a sloping line. These would still be considered as divergences if price is forming higher or lower peaks and valleys.
It would also help if you would have some knowledge on price action to indicate if price is about to reverse.
The stop-loss would be just a few pips below the entry candle for buy setups or a few pips above the entry candle for sell setups.
For the exits, we will be taking a partial take profit as the DeMarker indicator hits the 50% line. Also, as this happens, the stop-loss should be moved to break-even.
The final take profit should be taken as the DeMarker indicator crosses over the overbought line for buy setups or oversold line for sell setups.
Regular Bearish Divergence Setup
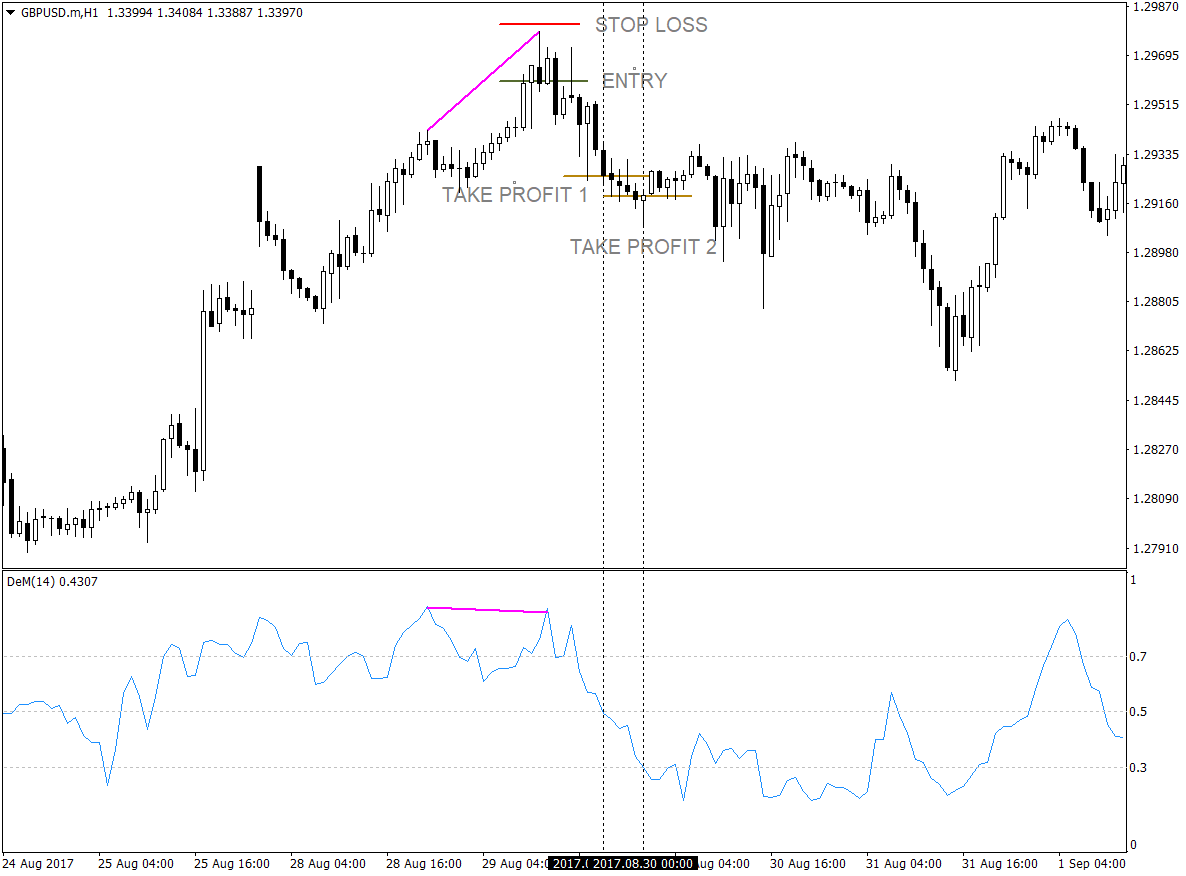
This is an example of a regular bearish divergence. The DeMarker indicator formed peaks above the overbought territory, which when connected, forms a somewhat downward sloping line. On the other hand, price formed a clear higher high. Also, price action did support the indication that price might reverse.
Positions were closed as soon as the DeMarker indicator touched the 50% line and the 30% line indicating it is already oversold. This trade earned 44 pips in total.
Hidden Bearish Divergence
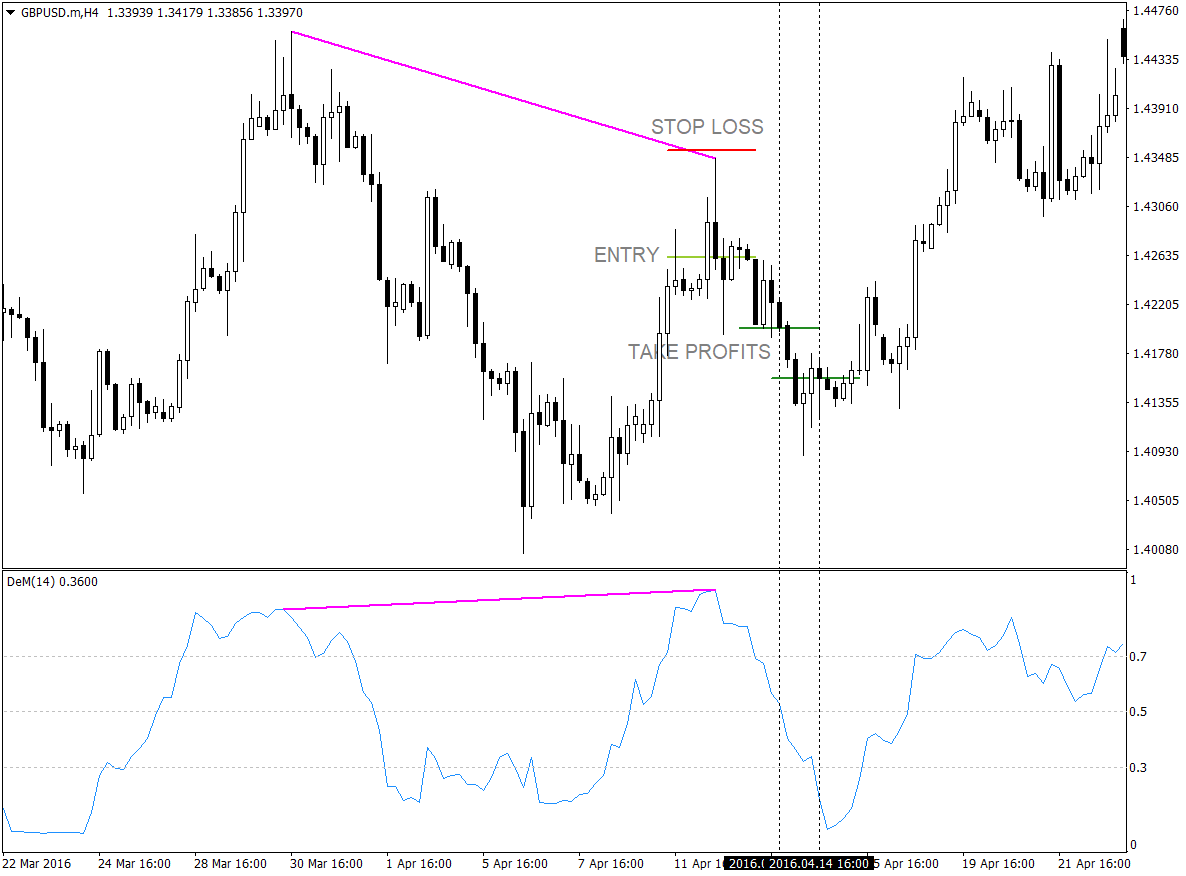
On this chart, we could see price forming a lower-high, while the DeMarker indicator formed a higher-high. This is considered as a hidden bearish divergence. If this trade was taken, it would have gained a total of 107 pips.
Hidden Bullish Divergence Setup
This setup is valid because price formed a higher-low while the DeMarker oscillator formed a lower-low, therefore this is a hidden bullish divergence. As soon as the DeMarker indicator touches the 50% and 70% line respectively, the partial and final take profits were taken. On this trade, 42 pips would have been gained if this trade was taken.
Regular Bullish Divergence
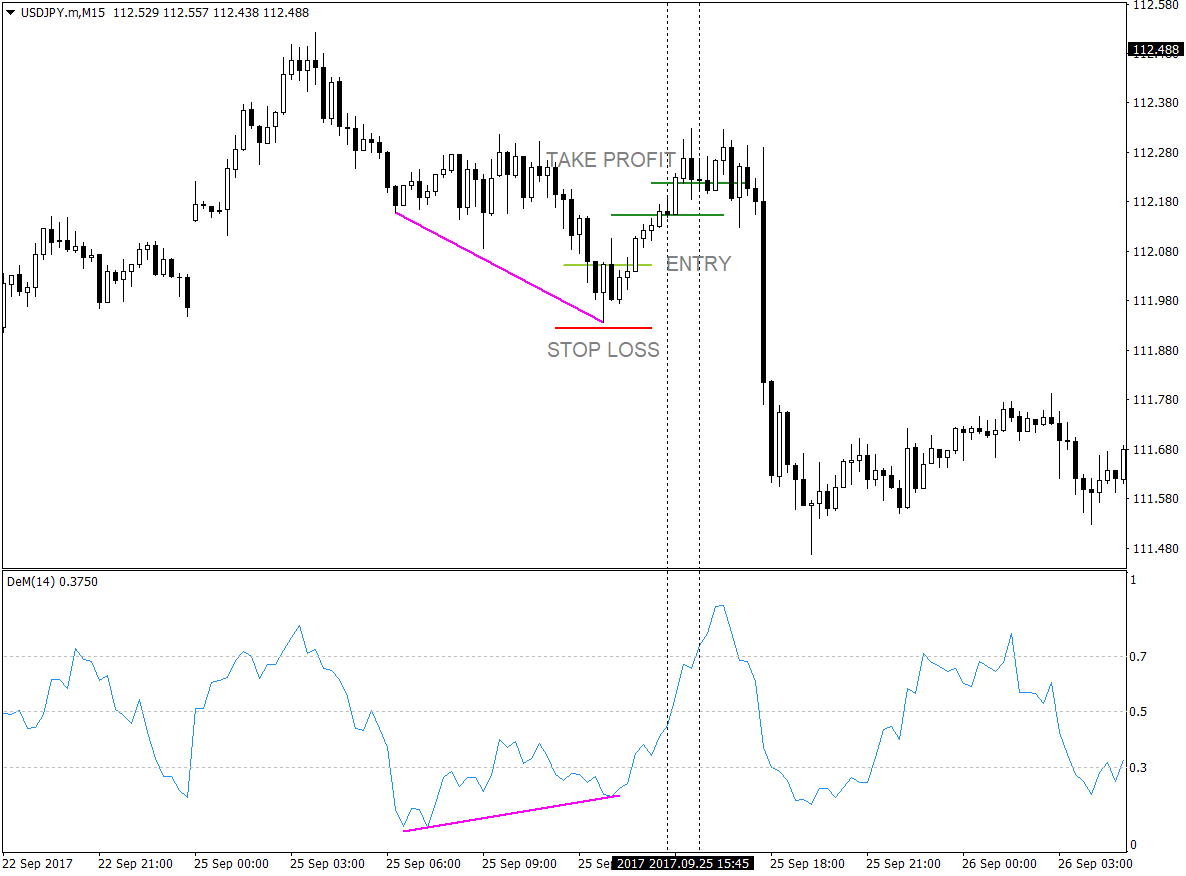
This is an example of a regular bullish divergence trade. Price formed a lower-low while the DeMarker oscillator formed a higher-low, making this setup a valid regular bullish divergence. This trade setup could have gained 17 pips for a decent scalping on a 15-minute chart.
Conclusion
The DeMarker oscillator is an excellent indicator to use in detecting divergences. Its jagged peaks and valleys and its overbought and oversold areas allow for easy detection of such divergences, plus it filters out divergences that still hasn’t crossed the oversold and overbought areas.
Since this strategy doesn’t use an indicator to pinpoint the exact entry candle, it would also be beneficial to have a little knowledge about price action.
If used properly and with good money management, this tool has the potential to help traders gain from the market.
Recommended MT4 Broker
- Free $50 To Start Trading Instantly! (Withdrawable Profit)
- Deposit Bonus up to $5,000
- Unlimited Loyalty Program
- Award Winning Forex Broker
- Additional Exclusive Bonuses Throughout The Year

>> Claim Your $50 Bonus Here <<
Click here below to download: