


Divergence trading is probably one of the most underrated technical analysis techniques that many new traders overlook. It is not as popular as a technique as most simplistic trading setups are. However, with the right oscillator indicator and the right parameters, traders could significantly improve their trading accuracy using divergences.
Divergences are basically discrepancies in the magnitude of the price swings based on price action compared to the swings based on peaks and troughs on an oscillator.
In trading, oscillators are technical indicators which typically indicate momentum by plotting lines or histogram bars that oscillate around a median or within a range. These oscillators would usually follow the movement of price action quite closely. It creates peaks whenever swing highs are formed and troughs whenever swing lows are formed.
The height and depth of an oscillators peaks and troughs would usually mirror that of the swing high and swing low of price action. However, there are instances wherein the height and depth of the peaks and troughs of an oscillator would differ from that of price action. These conditions are called divergences. Below is a chart of what the different types of divergences look like.
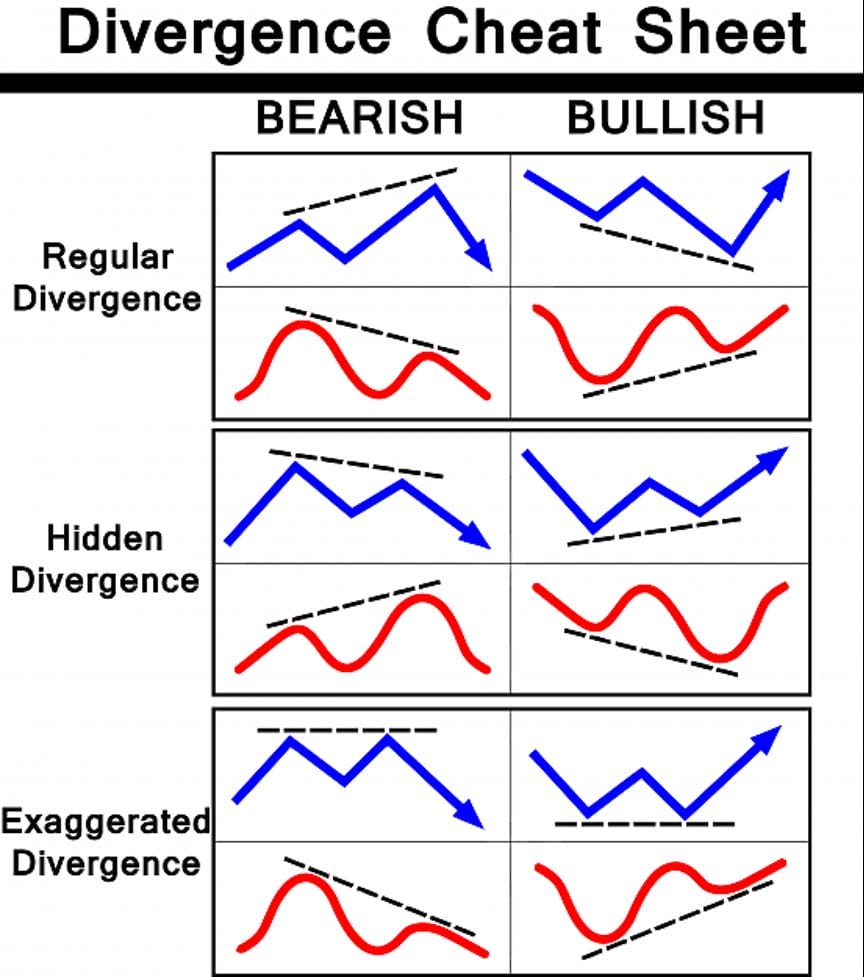
Hidden Divergences are particularly interesting because this type of divergence typically occurs in a trending market as defined by price action traders. Price action traders define an uptrend as price action creating higher swing highs and swing lows, while downtrends are defined as price action creating lower swing highs and swing lows. Based on the chart above, this is exactly what hidden divergence price action looks like. However, the oscillator in a hidden divergence would create an exaggerated peak or trough which indicates that price is overextended. This creates a prime condition for price to reverse and create and price swing in the direction of the trend.
Here we will examine a hidden divergence setup using a custom technical indicator, which is the Zero Lag MACD.
Zero Lag MACD
The Zero Lag MACD is a custom technical indicator which is based on the classic Moving Average Convergence and Divergence (MACD).
The classic MACD is a popular momentum oscillator which is based on the crossover of two moving average lines. It plots its MACD line based on the difference of two underlying moving average lines. This is called the MACD line. Other versions plot a histogram bar rather than a line, such as the Zero Lag MACD. The MACD then plots a signal line which is a moving average derived from the main MACD line or histogram.
Crossovers between the MACD line or histogram and the signal line indicate a momentum reversal. Traders can use this as an entry signal based on momentum reversals.
The location of the crossover also indicates the probability of the reversal. Crossovers occurring far from the midline indicate that price is either overbought or oversold and could be prime for a sharp reversal.
This indicator, being an oscillator, also works well when used with divergence techniques.
The traditional MACD may at times be too lagging. The Zero Lag MACD is a version of the MACD which significantly decreases the amount of lag making the indicator a great momentum reversal indicator.
Carter MA
Carter MA is a custom technical indicator which is based on moving averages. It plots a set of modified moving average lines which can be used to identify trend direction.
Traders use common moving average line periods to identify short-term, mid-term and long-term trends, such as the 21-period, 50-period, 100-period and 200-period moving average lines. Carter MA plots these moving average lines which helps traders identify the general trend direction.
Trend direction can be identified using the Carter MA indicator based on how the moving average lines are stacked. The market is in an uptrend if the short-term moving average lines are above the long-term moving average lines, and in a downtrend if the short-term moving average lines are below the long-term moving average lines. Traders can also identify if the market is reversing if the lines are crossing over or if the market is not trending if the lines are not clearly stacked.
The areas between the lines could also act as a dynamic area of support or resistance. Traders can trade bounces from these areas trading in the direction of the trend.
Trading Strategy
Carter MA Zero Lag MACD Divergence Forex Trading Strategy is a trend following divergence trading strategy which makes use of the Zero Lag MACD and the Carter MA indicator.
Trend direction is identified first using the Carter MA indicator. This is simply based on how the moving average lines are stacked.
The Carter MA indicator is also used as a dynamic area of support or resistance. Price action should show that it is respecting the area between the green and blue lines as an area of dynamic support or resistance.
The Zero Lag MACD is used to identify hidden divergences comparing its peaks troughs with swing highs and swing lows of price action. Valid trade setups are considered if a hidden divergence is observed.
Trade signals are generated as soon as the MACD bars cross the signal line.
Indicators:
- Carter_MA
- Color #0: None
- ZeroLag_MACD
Preferred Time Frames: 1-hour, 4-hour and daily charts
Currency Pairs: FX majors, minors and crosses
Trading Sessions: Tokyo, London and New York sessions
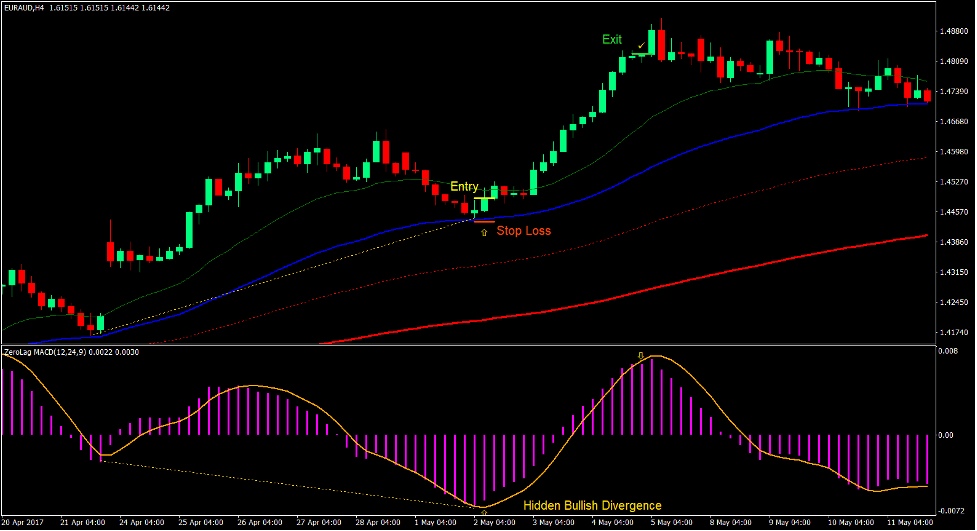
Buy Trade Setup
Entry
- The Carter MA lines should be stacked in the following order:
- Green Line: top
- Blue Line: second from the top
- Dotted Red Line: second from the bottom
- Solid Red Line: bottom
- Price action should retrace towards the area between the green and blue lines.
- Price action should show signs of bullish price rejection on the dynamic support area.
- A bullish hidden divergence should be observed on the Zero Lag MACD.
- Enter a buy order as soon as the bars on the Zero Lag MACD crosses above the signal line.
Stop Loss
- Set the stop loss on a support below the entry candle.
Exit
- Close the trade as soon as the bars on the Zero Lag MACD crosses below the signal line.

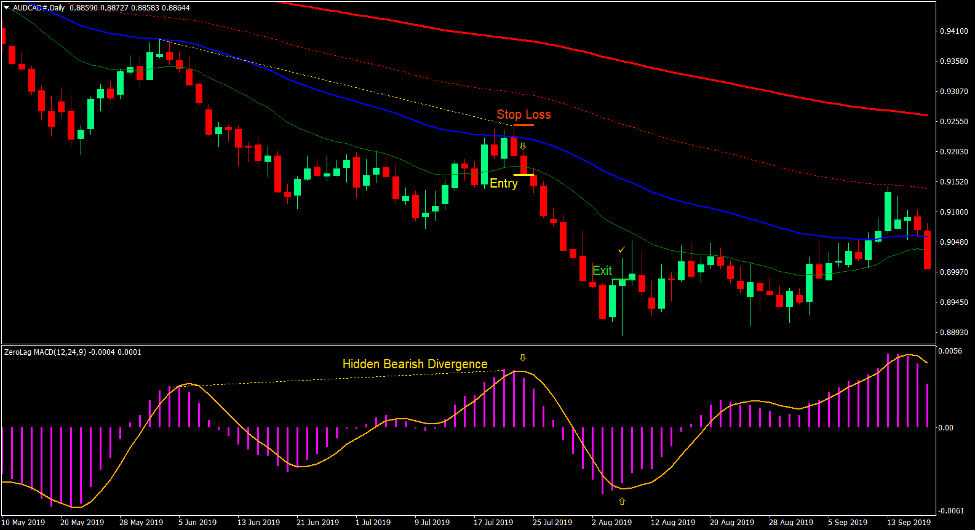
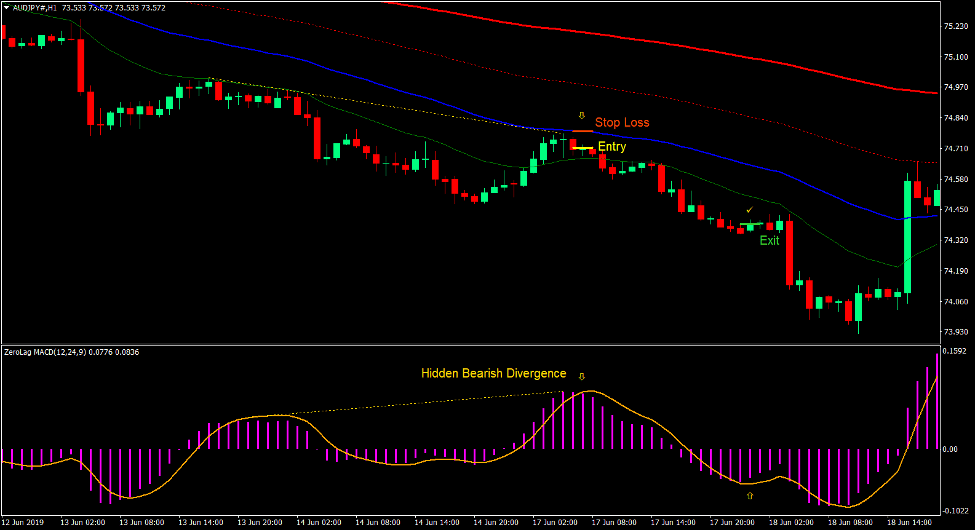
Sell Trade Setup
Entry
- The Carter MA lines should be stacked in the following order:
- Green Line: bottom
- Blue Line: second from the bottom
- Dotted Red Line: second from the top
- Solid Red Line: top
- Price action should retrace towards the area between the green and blue lines.
- Price action should show signs of bearish price rejection on the dynamic resistance area.
- A bearish hidden divergence should be observed on the Zero Lag MACD.
- Enter a sell order as soon as the bars on the Zero Lag MACD crosses below the signal line.
Stop Loss
- Set the stop loss on a resistance above the entry candle.
Exit
- Close the trade as soon as the bars on the Zero Lag MACD crosses above the signal line.
Conclusion
This simple trading strategy is an effective trend following strategy, which is combined with a divergence trading setup. This strategy could also be considered as a high probability trading strategy.
There are traders who use the same type of trading strategy who claim to have an accuracy level of around 60%.
The key trading this strategy is in being disciplined enough to trade only when the market is clearly trending and to avoid trading if it is not.
Recommended MT4 Brokers
XM Broker
- Free $50 To Start Trading Instantly! (Withdraw-able Profit)
- Deposit Bonus up to $5,000
- Unlimited Loyalty Program
- Award Winning Forex Broker
- Additional Exclusive Bonuses Throughout The Year

>> Sign Up for XM Broker Account here <<
FBS Broker
- Trade 100 Bonus: Free $100 to kickstart your trading journey!
- 100% Deposit Bonus: Double your deposit up to $10,000 and trade with enhanced capital.
- Leverage up to 1:3000: Maximizing potential profits with one of the highest leverage options available.
- ‘Best Customer Service Broker Asia’ Award: Recognized excellence in customer support and service.
- Seasonal Promotions: Enjoy a variety of exclusive bonuses and promotional offers all year round.

>> Sign Up for FBS Broker Account here <<
Click here below to download: