


Many traders would want to trade a strategy with a high win rate. Although this is not the only way to go in order to have a profitable trading strategy, but it is one of the most viable ways to profit the market. It allows traders to consistently win allowing them to have a more relaxed state when trading. But how do you get a strategy with a high win rate?
Confluence is probably one of the most logical ways to be consistent in the market. This is because the probability of a trade being profitable increases whenever there are many different analyses indicating the same trade direction. It is like asking a group of people which direction to take to go to a certain place. The more people pointing the same direction, the more likely it is that you are given the right direction. Although this is not foolproof, trading using confluences does result to profits in the long run.
The Squeeze Trend Forex Trading Strategy is one which emphasizes trade direction confluences using multiple moving averages and a combination of commonly used indicators that work well even as a standalone indicator.
The Guppy Multiple Moving Averages (GMMA)
The Guppy Multiple Moving Averages (GMMA) was developed by Daryl Guppy, an Australian trader. It was intended to show how a set of moving averages could indicate trend.
The original GMMA was composed of 12 moving averages. It was divided into two sets, a short-term and a long-term set. The short-term set was composed of moving averages with the periods of 3, 5, 8, 10, 12 and 15, while the long-term set was composed of 30, 35, 40, 45, 50 and 60.
These moving averages could be used to interpret the trend in different ways. It could be used to identify trend direction based on how the moving averages are stacked. If the shorter-term moving averages are above the longer-term moving averages, the market is said to be bullish. If it was the inverse, then the market is considered bearish.
It could also be used to identify trend strength. If the moving averages are fanning out, then the trend is said to be strong, while if the moving averages are contracting, then the trend might be weakening.
Lastly, it could also identify trend reversals based on the crossing over of the short-term and long-term set. A cross above would be considered a bullish reversal, while a cross below will be a bearish reversal.
Bollinger Squeeze with MACD Indicator
The Bollinger Bands is one of the most popular indicators among many traders. This is probably due to the many different ways that the Bollinger Bands could be used. It is a moving average, which makes it viable to be used as a trend following indicator. It is also an oversold and overbought indicator, which many mean reversal traders use. On the flip side, if you would trade on the direction of the overbought and oversold areas, it could also be used as a momentum indicator.
However, there is another way to use the Bollinger Bands that many new traders might not be familiar with. Aside from those mentioned above, the Bollinger Bands is also a volatility indicator. The bands tend to contract on a low volatility period and expands during a high volatility period. Markets tend to be a cycle of contractions and expansions. What follows a contraction phase is usually an expansion phase. Trading on the edge of the contraction phase just before the expansion phase is a high reward trading strategy due to the sheer speed that price could move.
The Moving Average Convergence and Divergence indicator is also a commonly used indicator. It is basically a modified crossover of moving averages, which is based on a difference of two moving averages and its relation to another moving average, which is considered the signal line. The MACD is a commonly used oscillating indicator, which could be plotted either as histograms or as two lines crossing over each other.
The Bollinger Squeeze with MACD indicator is a custom indicator meant to provide signals on the confluence of a Bollinger Squeeze and MACD reversal condition.
Trading Strategy Concept
This strategy aims to make profit out of the market by trading on the confluence of the Guppy Multiple Moving Average’s long-term set and the Bollinger Squeeze with MACD indicator. The Guppy Multiple Moving Average’s long-term set is composed of six moving averages. Add to it the confluence of the Bollinger Squeeze and MACD reversals, we get a strong confluence of many indicators combined in this strategy.
To trade this strategy, we would have to trade in the direction of the GMMA’s long-term trend. Then, we wait for the Bollinger Squeeze with MACD indicator to indicate a signal that agrees with the GMMA’s trend. This would usually result to a trade that would run into profit.
Indicators
- GMMA_Long
- Fractals
- my_squeeze_Light
Timeframe: preferably 1-hour and 4-hour charts
Currency Pairs: major and minor pairs
Trading Session: Tokyo, London and New York session
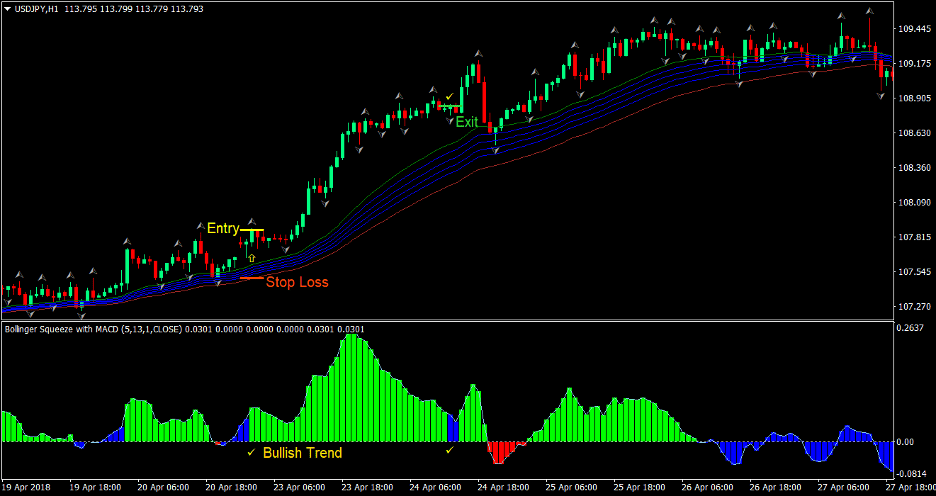
Buy (Long) Trade Setup
Entry
- The GMMA_Long indicator should have its green moving average above and the brown moving average below indicating a bullish long-term trend
- Wait for the my_squeeze_light indicator to print a lime histogram bar indicating that the Bollinger Band Squeeze and MACD is in confluence indicating a bullish market condition
- Enter a buy order at the confluence of the above rules
Stop Loss
- Set the stop loss at the fractal below the entry candle
Exit
- Close the trade as soon as the my_squeeze_light indicator prints either a blue or red histogram bar indicating that the bullish confluence has ended
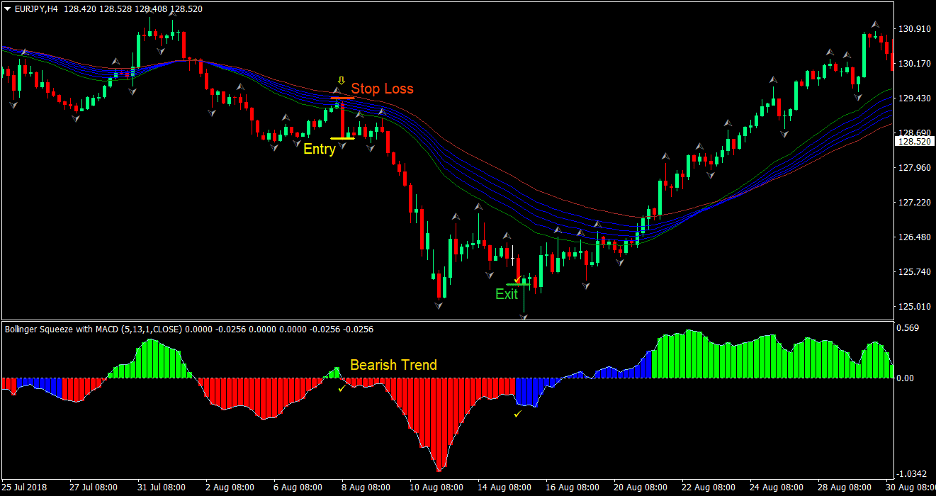
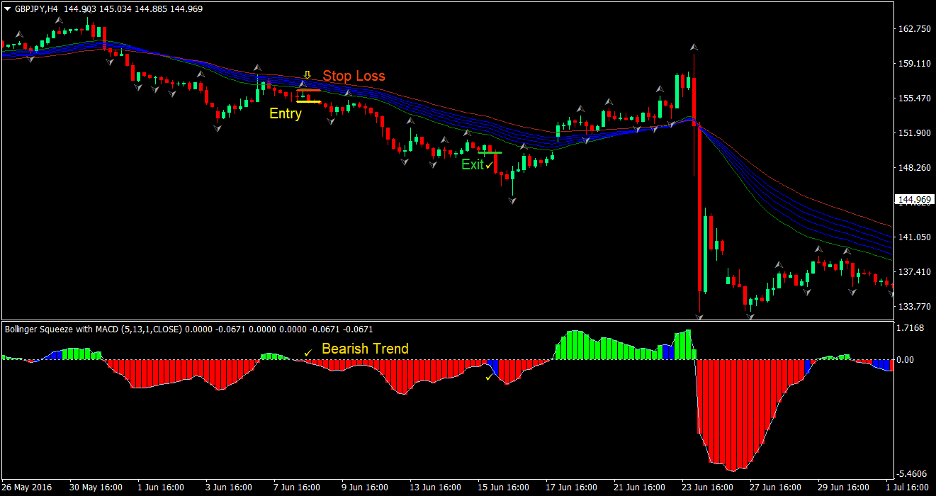
Sell (Short) Trade Setup
Entry
- The GMMA_Long indicator should have its brown moving average above and the green moving average below indicating a bearish long-term trend
- Wait for the my_squeeze_light indicator to print a red histogram bar indicating that the Bollinger Band Squeeze and MACD is in confluence indicating a bearish market condition
- Enter a sell order at the confluence of the above rules
Stop Loss
- Set the stop loss at the fractal above the entry candle
Exit
- Close the trade as soon as the my_squeeze_light indicator prints either a blue or lime histogram bar indicating that the bearish confluence has ended
Conclusion
This strategy is a high probability trading strategy. This is due to the fact that many indicators are in confluence pointing the same direction. In most cases, the trade would be in profit. Most trades would go into profit territory and if managed properly, should result to a winning trade.
There are cases however, when price wouldn’t push strongly enough going the direction of the trade. The key to profiting with this strategy though is to move the stop loss into profit territory as soon as price has moved in your direction.
Recommended MT4 Brokers
XM Broker
- Free $50 To Start Trading Instantly! (Withdraw-able Profit)
- Deposit Bonus up to $5,000
- Unlimited Loyalty Program
- Award Winning Forex Broker
- Additional Exclusive Bonuses Throughout The Year

>> Sign Up for XM Broker Account here <<
FBS Broker
- Trade 100 Bonus: Free $100 to kickstart your trading journey!
- 100% Deposit Bonus: Double your deposit up to $10,000 and trade with enhanced capital.
- Leverage up to 1:3000: Maximizing potential profits with one of the highest leverage options available.
- ‘Best Customer Service Broker Asia’ Award: Recognized excellence in customer support and service.
- Seasonal Promotions: Enjoy a variety of exclusive bonuses and promotional offers all year round.

>> Sign Up for FBS Broker Account here <<
Click here below to download: