


Trending markets are probably one of the easiest markets to trade. When trading, there are two variables that make or break a trade entry. Trading in a trending market easily answers one of these two questions. Trending markets could easily tell us whether the market is more likely to go up or down. Now, although markets may reverse when a trend is at its peak, price is usually more likely to move in the direction of the trend rather than against it. This is probably the reason why many traders prefer to trade during trending market conditions.
Although the first variable is out of the way, the hard part is not over yet. Timing the market is way more difficult compared to identifying where the market is headed, and this is where most traders mess up. In fact, a forex broker company has already disclosed that most traders get trade direction right most of the time. However, traders still lose money because they get trade entries and exits wrong. So, how do we fix this?
SAR HAMA Bounce Forex Trading Strategy is a trend following strategy that helps traders identify which direction to trade and when to take the trades. Not only that, it also provides traders a clue as to where price might probably bounce off and resume the trend direction.
HAMA Indicator
HAMA basically stands for Heiken Ashi Moving Average. This indicator is a variation of the Heiken Ashi Candlesticks and Heiken Ashi Smoothed indicator.
It provides traders an indication regarding the direction of the trend by plotting bars on the price chart. The bars follow the movements of price action and change colors depending on the direction of the trend. Blue bars generally indicate a bullish trend, while red bars indicate a bearish trend.
The HAMA indicator is derived from a modified moving average line. It is characterized by a smooth yet very responsive moving average, creating bars that follow price action quite well. The bars also tend to work well as a dynamic area of support or resistance. Price tends to respect the HAMA bars and bounce off it right after a retracement.
SAR Oscillator
SAR Oscillator is a custom indicator used to determine short-term trends and momentum. It is based on the popular Stop and Reverse (SAR) indicator, which is a great indicator for identifying trends.
The SAR Oscillator is displayed with bars that could oscillate to positive or negative. Bars that are positive indicate a bullish momentum or trend direction, while bars that are negative indicate a bearish momentum or trend direction. The bars also change color depending on the direction of the trend. Green bars indicate a bullish trend, while red bars indicate a bearish trend.
The SAR Oscillator indicator could be used as a trend filter. Traders could use it to filter out trades that are not aligned with the trend. It could also be used as an entry trigger. Traders could use the crossing over of the bars from positive to negative or vice versa, as an indication of a probable momentum or short-term trend reversal.
Trading Strategy
This strategy is a trend following strategy that uses the HAMA and SAR Oscillator to identify reversal areas and entries. It also aligns its trades with the long-term trend.
To identify the long-term trend, we will be using the 100-period Exponential Moving Average (EMA). Trend direction will be based on the location of price and the HAMA bars in relation to the 100 EMA line, as well as the slope of the 100 EMA line.
The HAMA bars will be used as an area of dynamic support or resistance. Price should retrace to the area of the HAMA bars and bounce off it. This is an indication of a resumption of the trend direction.
The SAR Oscillator bars will be used to confirm the resumption of the trend direction. The color of the bars should temporarily change during the retracement. As price bounces off the HAMA bars, the color of the SAR Oscillator bars should revert to the color of the trend.
Indicators:
- 100 EMA (Green)
- HAMA (default setting)
- SAR_oscillator (default setting)
Currency Pairs: major and minor pairs
Preferred Time Frames: 30-minute, 1-hour and 4-hour charts
Trading Sessions: Tokyo, London and New York sessions
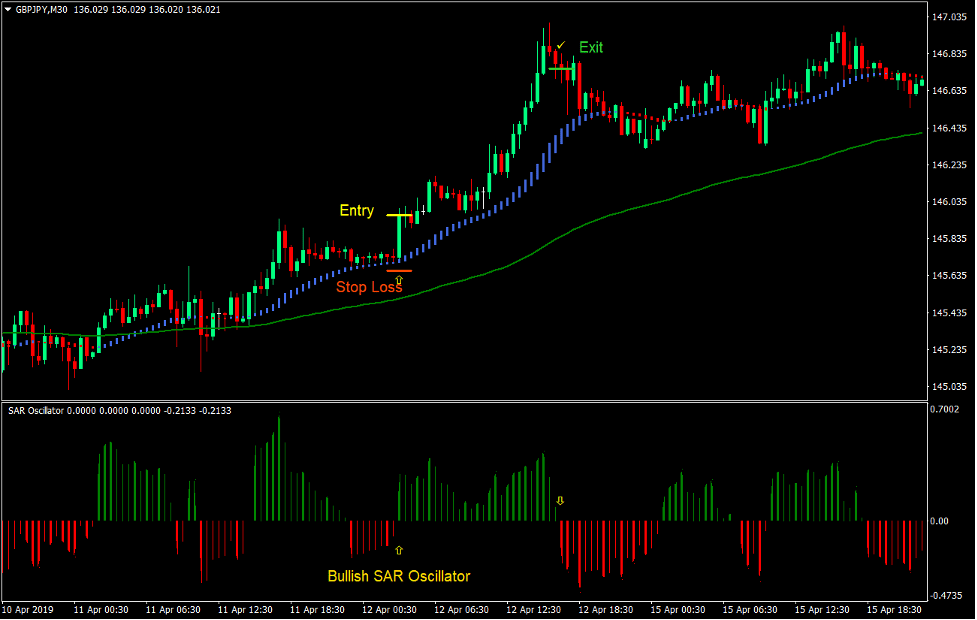
Buy Trade Setup
Entry
- Price and the HAMA bars should be above the 100 EMA line.
- The 100 EMA line should be sloping up.
- The HAMA bars should generally be blue most of the time.
- Price should retrace towards the HAMA bars.
- The SAR Oscillator bars should temporarily change to red.
- Price should bounce off the HAMA bars.
- The SAR Oscillator bars should revert to green.
- Enter a buy order on the confirmation of these conditions.
Stop Loss
- Set the stop loss on the fractal below the entry candle.
Exit
- Close the trade as soon as the SAR Oscillator bars change to red.
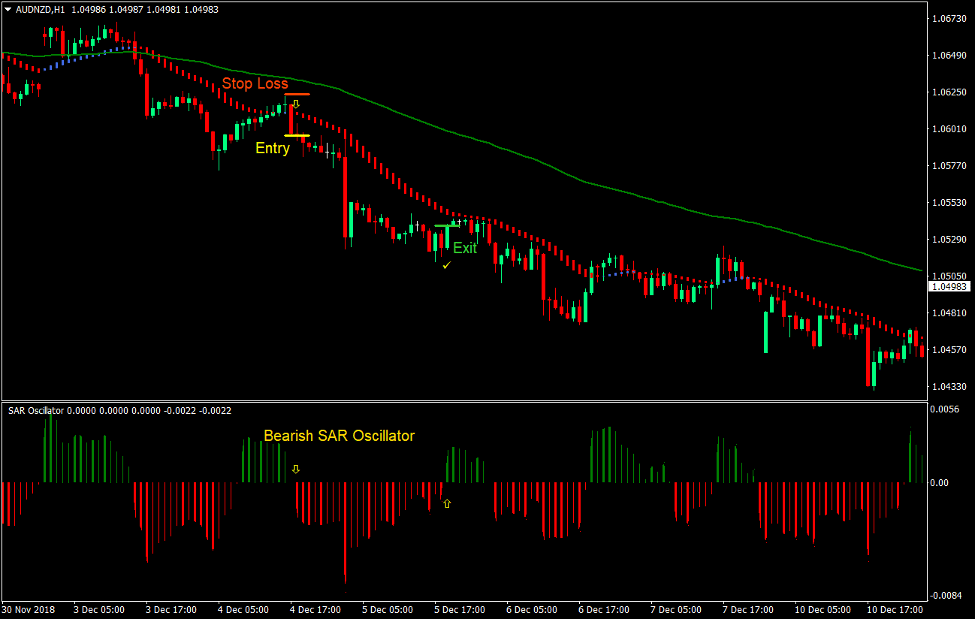
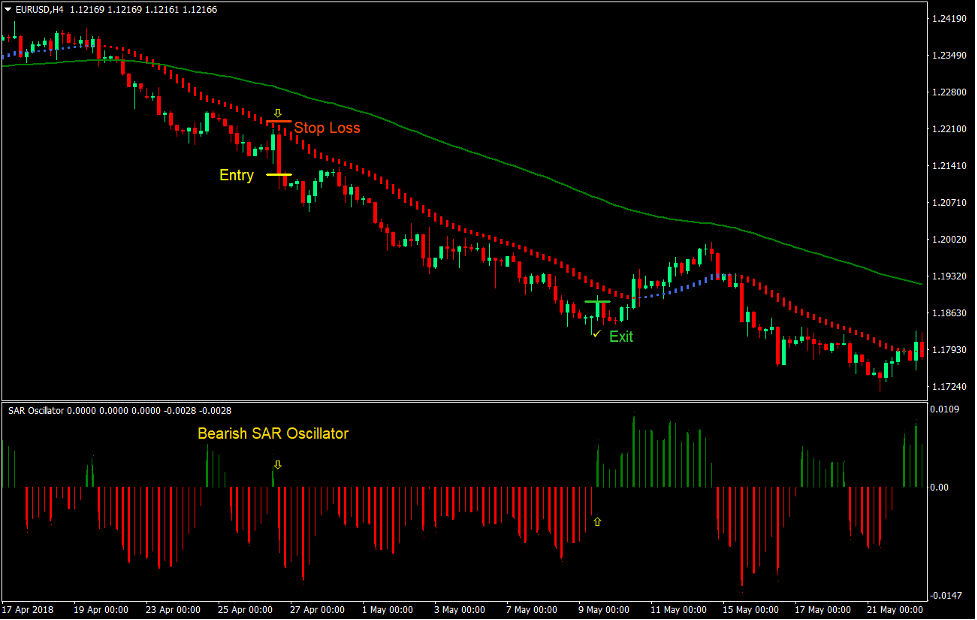
Sell Trade Setup
Entry
- Price and the HAMA bars should be below the 100 EMA line.
- The 100 EMA line should be sloping down.
- The HAMA bars should generally be red most of the time.
- Price should retrace towards the HAMA bars.
- The SAR Oscillator bars should temporarily change to green.
- Price should bounce off the HAMA bars.
- The SAR Oscillator bars should revert to red.
- Enter a sell order on the confirmation of these conditions.
Stop Loss
- Set the stop loss on the fractal above the entry candle.
Exit
- Close the trade as soon as the SAR Oscillator bars change to green.
Conclusion
This trading strategy is a working trend following strategy that provides trade entries on retracements.
Trading on trending market conditions based on bounces off a dynamic area of support or resistance is a working trading strategy. Trading on bounces of the HAMA bars is a great way to trade retracements. This strategy simply helps traders identify the trending markets by adding the 100 EMA line. It also helps traders identify specific entry points with the confirmation of the SAR Oscillator indicator.
All in all, this strategy is a high probability trading strategy when used in a trending market. It also has a decent reward-risk ratio. When combined, this could be recipe for consistent profits over the long-term.
Recommended MT4 Brokers
XM Broker
- Free $50 To Start Trading Instantly! (Withdraw-able Profit)
- Deposit Bonus up to $5,000
- Unlimited Loyalty Program
- Award Winning Forex Broker
- Additional Exclusive Bonuses Throughout The Year

>> Sign Up for XM Broker Account here <<
FBS Broker
- Trade 100 Bonus: Free $100 to kickstart your trading journey!
- 100% Deposit Bonus: Double your deposit up to $10,000 and trade with enhanced capital.
- Leverage up to 1:3000: Maximizing potential profits with one of the highest leverage options available.
- ‘Best Customer Service Broker Asia’ Award: Recognized excellence in customer support and service.
- Seasonal Promotions: Enjoy a variety of exclusive bonuses and promotional offers all year round.

>> Sign Up for FBS Broker Account here <<
Click here below to download: