


Introduction to the RSI Peak and Bottom Indicator
The Relative Strength Index (RSI) Indicator is one of the most popular momentum-based oscillators. The RSI Peak and Bottom Indicator was developed based on the RSI with the intention of allowing traders to identify the peaks and bottoms of the RSI line more effectively.
What is the RSI Peak and Bottom Indicator?
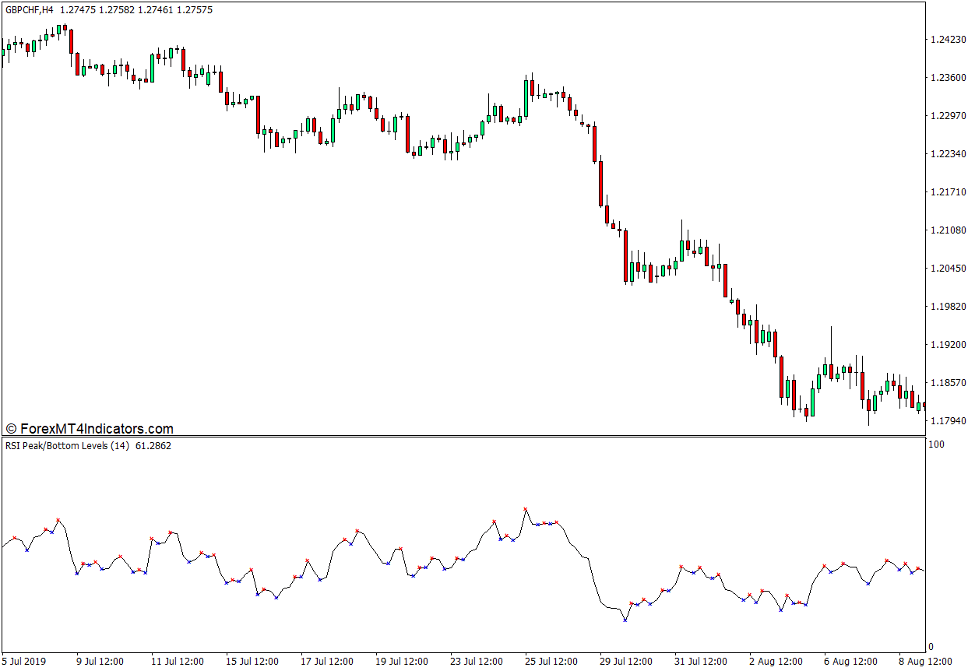
The RSI Peak and Bottom Indicator is a momentum indicator which is based on the Relative Strength Index (RSI). It is an oscillator type of technical indicator which plots a line that could oscillate within the range of zero to 100. The oscillations that it plots are similar to the RSI Indicator. The difference is that it plots “x” marks on the peaks and dips of its oscillations.
In this template, the indicator plots red “x” marks on the peaks of the oscillations and blue “x” marks on the dips of the oscillations.
How the RSI Peak and Bottom Indicator Works?
The RSI Peak and Bottom Indicator has an algorithm which is similar to the RSI Indicator. It calculates for the ratio between the average gain and average loss and uses that ratio to calculate for the RSI value.
RSI (Step One) = 100 – [100 / (1 + (Average Gain / Average Loss))]
RSI (Step Two) = 100 – [100 / (1 + ((Previous Average Gain x 13) + Current Gain) / -((Previous Average Loss x 13) + Current Loss)]
The resulting value would then be a point on the RSI line. The indicator would then connect the points to produce the oscillations of the RSI line.
The indicator then detects sudden changes in the direction of the slope of the RSI line and plots the “x” marks whenever it detects a peak or a dip.
How to use the RSI Peak and Bottom Indicator for MT4
The RSI Peak and Bottom Indicator has just one variable which can be modified within the indicator settings.

“PeriodRSI” allows users to modify the number of periods in which the indicator would calculate for the RSI value.
Buy Trade Setup
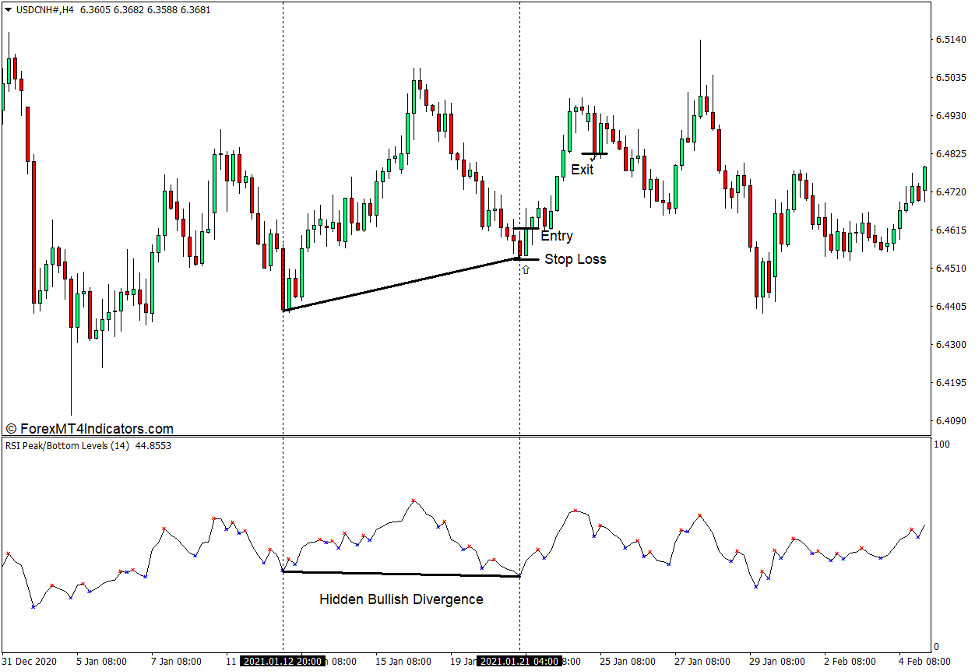
When to Enter?
Identify a bullish divergence and open a buy order if a bullish divergence is confirmed in confluence with a bullish reversal price action.
When to Exit?
Close the trade as soon as price action shows signs of a possible bearish reversal.
Sell Trade Setup
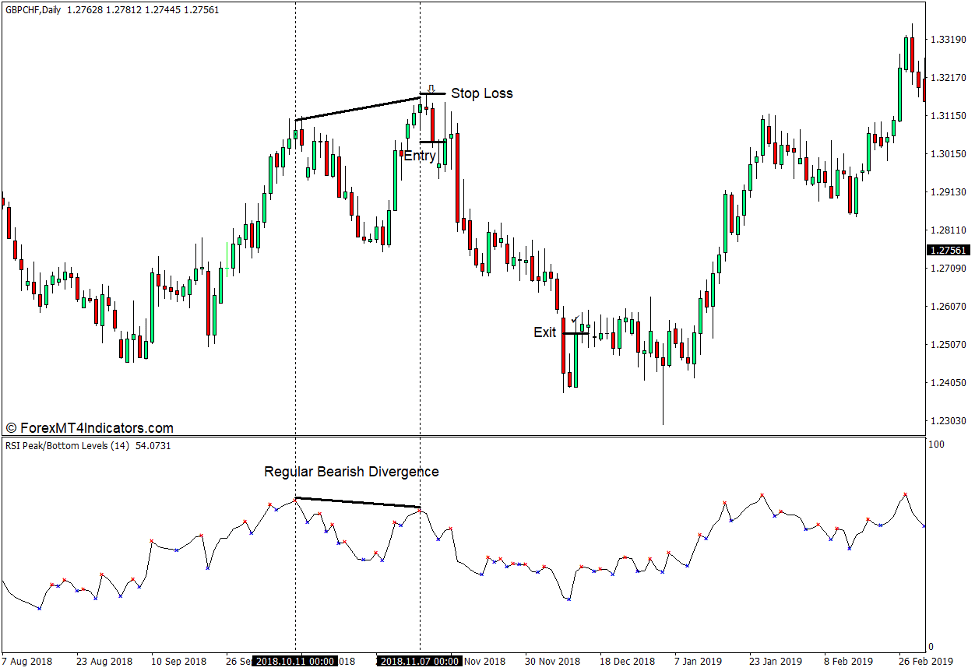
When to Enter?
Identify a bearish divergence and open a sell order if a bearish divergence is confirmed in confluence with a bearish reversal price action.
When to Exit?
Close the trade as soon as price action shows signs of a possible bullish reversal.
Conclusion
This indicator is very similar to the regular Relative Strength Index (RSI) Indicator which is available on the MT4 platform. The difference is that this indicator plots “x” marks on the peaks and dips. This allows traders to identify the peaks and dips more effectively and use it for various technical trading setups such as divergences. Traders can also add markers on various levels on the RSI range to make it useful for trading strategies such as mean reversals and trend continuation.
Recommended MT4/MT5 Brokers
XM Broker
- Free $50 To Start Trading Instantly! (Withdraw-able Profit)
- Deposit Bonus up to $5,000
- Unlimited Loyalty Program
- Award Winning Forex Broker
- Additional Exclusive Bonuses Throughout The Year

>> Sign Up for XM Broker Account here <<
FBS Broker
- Trade 100 Bonus: Free $100 to kickstart your trading journey!
- 100% Deposit Bonus: Double your deposit up to $10,000 and trade with enhanced capital.
- Leverage up to 1:3000: Maximizing potential profits with one of the highest leverage options available.
- ‘Best Customer Service Broker Asia’ Award: Recognized excellence in customer support and service.
- Seasonal Promotions: Enjoy a variety of exclusive bonuses and promotional offers all year round.

>> Sign Up for FBS Broker Account here <<

(Free MT4 Indicators Download)
Click here below to download: