


Although many non-traders and even traders believe that trading is very difficult, truth of the matter is, the concept of trading the forex markets is very simple. Forex traders simply must buy a currency pair when they believe that price is going up and sell it back to the market once price is higher than their entry price. On the flip side, traders can also short a currency pair when they believe price will go down, then buy it back again when price is lower than their entry point.
However, most traders experience a lot of difficulty trading the forex market not because it is difficult but because they overcomplicate things. One of my trading mentors even said that the main reason forex trading is difficult is not because it is inherently difficult but because traders feel the need to be doing something to earn even though they should just let their trades play out. If a trader has a profitable trading strategy, he or she should be able to draw consistent profits over the long run. The law of large numbers would prove to them that their strategies are profitable.
With that said, simple trading strategies could work very well in the forex market. As long as a trader is either winning more often than they are losing, as in a high win rate strategy, or winning bigger than they are losing, which is a high risk-reward strategy, that trader should be profitable over the long run.
Simple trading strategies such as pattern breakouts work well in the forex market or any other trading market. This is because these breakout points are often high probability entry points to enter the market. On top of this, most pattern trading strategies allow for a positive risk-reward ratio.
Heiken Ashi Candlesticks
Traders have been traditionally viewing their charts as a bar chart. Then came the Japanese candlesticks, which revolutionized the way traders look at their charts. Now, they can easily identify the direction of each candle based on its color. Traders could also easily interpret price action based on the high and low of price in relation to its opening and closing price. Most traders nowadays use Japanese candlesticks to view a tradeable security or forex pair.
However, new innovations coming from the Japanese have also been recently developed. The Heiken Ashi Candlesticks is a new method of viewing price which is a modification of the original Japanese candlesticks.
Heiken Ashi Candlesticks plot the standard high and low of each period just as the original Japanese candlestick. However, instead of plotting the open and close of each candle, the Heiken Ashi Candlesticks modify it based on the average movement of price. This creates candles which change color only when the short-term trend or momentum has shifted.
The Heiken Ashi Candlesticks are excellent indicators to help traders identify short-term momentum reversals as well as the current short-term trend direction.
Moving Average Convergence and Divergence
Moving Average Convergence and Divergence or more popularly known as the MACD, is a classic momentum technical indicator which is probably one of the most widely used oscillating technical indicator.
The MACD, as the name suggests, is based on the crossing over of a pair of moving averages.
It is computed by subtracting the value of an Exponential Moving Average (EMA) from a faster moving EMA line. This is usually plotted as a histogram bar representing the MACD.
Then, a signal line is derived from the prior MACD bars or line. The signal line is basically a Simple Moving Average (SMA) of the prior MACD bars or lines.
Trend direction and bias is based on the location of the MACD bars or line and the signal line in relation to its midline, which is zero. Positive values indicate a bullish trend bias, while negative values indicate a bearish trend bias. The trend is also considered bullish if the MACD bars or line is above the signal line, and bearish if it is below the signal line.
Trading Strategy
Heiken Ashi 20-50 Forex Trading Strategy is a simple trend following strategy which is based on momentum breakouts of supports and resistances formed during retracement or contraction periods. It also makes use of the two indicators above to confirm the trade setup.
The MACD is used to identify the trend direction bias. This is based on whether the histogram bars and the signal line are positive or negative. This should also agree with the trend direction indicated by the crossing over of the 20-period and 50-period EMA lines.
During a trending market, price should retrace towards the area of the 20-period EMA line. This should create a minor support or resistance line. Trade setups are developed as price breaks out of the support or resistance line towards the direction of the trend.
The Heiken Ashi Candlesticks are used to confirm the short-term momentum reversal occurring aftern the retracement, in the direction of the trend.
Indicators:
- 20 EMA
- 50 EMA
- Heiken Ashi
- MACD
- Fast EMA: 17
- Slow EMA: 31
- MACD SMA: 14
Preferred Time Frames: 15-minute, 30-minute, 1-hour and 4-hour charts
Currency Pairs: FX majors, minors and crosses
Trading Sessions: Tokyo, London and New York sessions
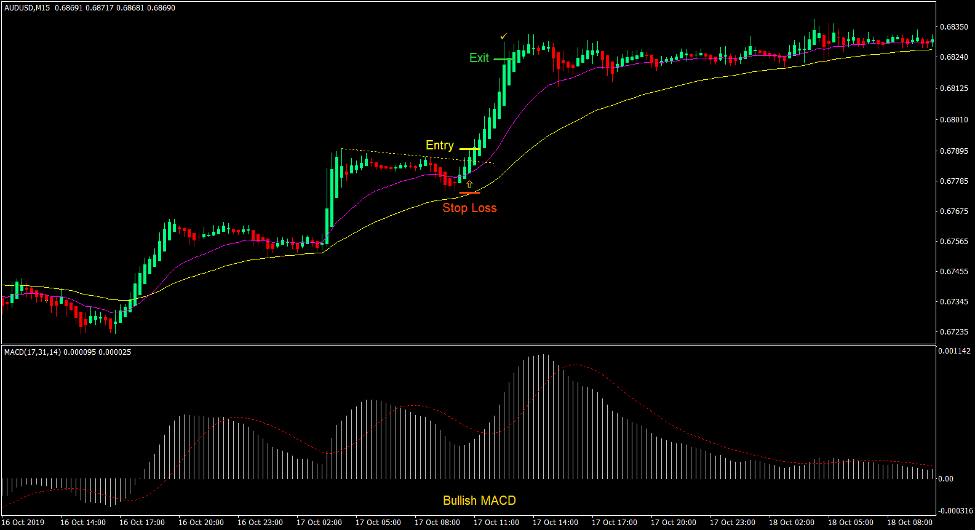
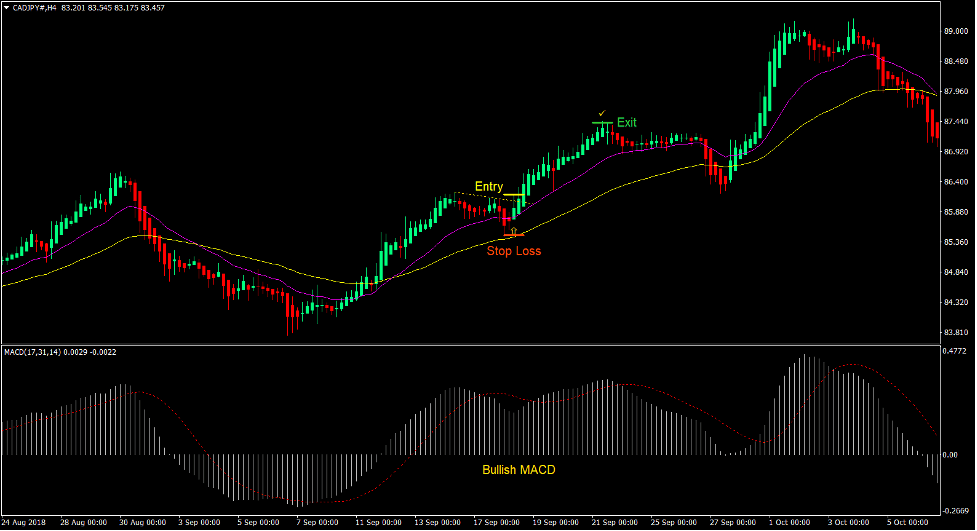
Buy Trade Setup
Entry
- The 20 EMA line should be above the 50 EMA line.
- The MACD bars and signal line should be positive.
- Price should retrace towards the area of the 20 EMA line.
- A resistance line should be formed.
- Price should break above the resistance line.
- The Heiken Ashi Candlesticks should change to green.
- Place a buy stop order above the high of the Heiken Ashi Candlestick.
Stop Loss
- Set the stop loss on the support below the entry candle.
Exit
- Set the take profit target at 2x the risk on the stop loss.
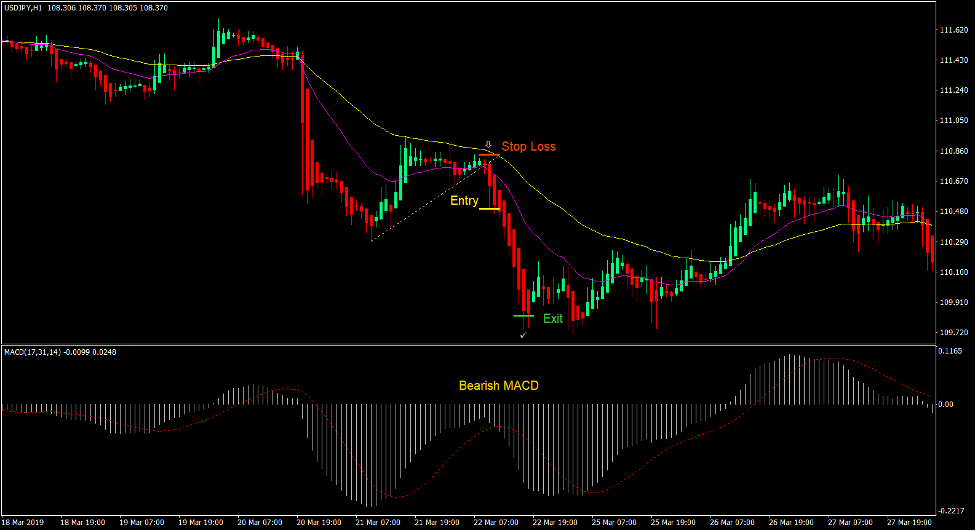
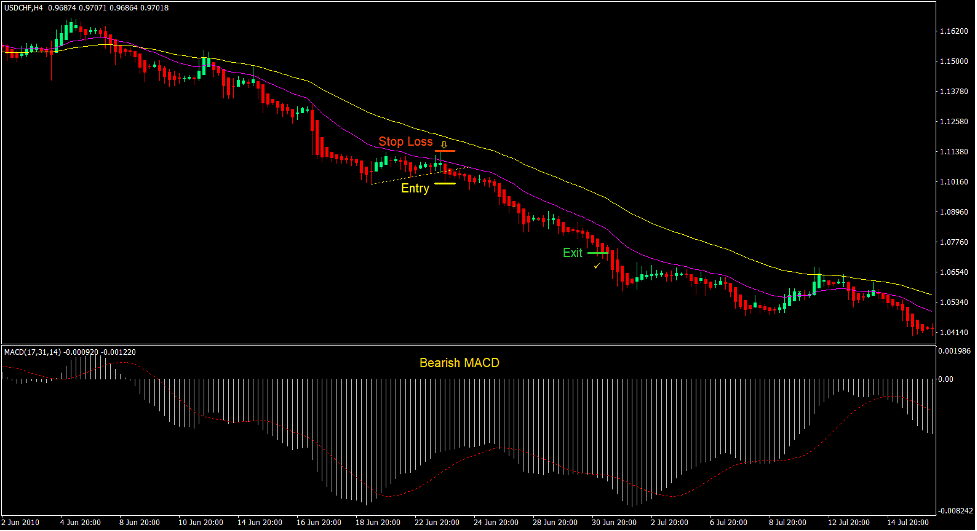
Sell Trade Setup
Entry
- The 20 EMA line should be below the 50 EMA line.
- The MACD bars and signal line should be negative.
- Price should retrace towards the area of the 20 EMA line.
- A support line should be formed.
- Price should break below the support line.
- The Heiken Ashi Candlesticks should change to red.
- Place a sell stop order below the low of the Heiken Ashi Candlestick.
Stop Loss
- Set the stop loss on the resistance above the entry candle.
Exit
- Set the take profit target at 2x the risk on the stop loss.
Conclusion
This trading strategy is a working trading strategy. If you would look closely, the support or resistance lines formed during a retracement would usually be a part of a flag pattern. Flag patterns are high probability trend continuation patterns. However, identifying these patterns could prove to be very difficult. By combining these technical indicators to form this template, traders can now more easily identify these conditions as breakouts right after a retracement that occur during strong trending markets.
Recommended MT4 Brokers
XM Broker
- Free $50 To Start Trading Instantly! (Withdraw-able Profit)
- Deposit Bonus up to $5,000
- Unlimited Loyalty Program
- Award Winning Forex Broker
- Additional Exclusive Bonuses Throughout The Year

>> Sign Up for XM Broker Account here <<
FBS Broker
- Trade 100 Bonus: Free $100 to kickstart your trading journey!
- 100% Deposit Bonus: Double your deposit up to $10,000 and trade with enhanced capital.
- Leverage up to 1:3000: Maximizing potential profits with one of the highest leverage options available.
- ‘Best Customer Service Broker Asia’ Award: Recognized excellence in customer support and service.
- Seasonal Promotions: Enjoy a variety of exclusive bonuses and promotional offers all year round.

>> Sign Up for FBS Broker Account here <<
Click here below to download: