


Forex Bollinger Bands Strategy Introduction
[toc]To be honest, Bollinger Bands indicator is my favorite trading tool to help me succeed in trading. I like it because there are many bollinger bands strategies which can apply to this single Bollinger Bands indicator. And that are what I’m going to teach you in this post.
I don’t like to waste a lot of my time and you should too because time is gold and that’s why I’m keeping this post short and to the point. That way you never get bored and easy to digest this information provided in this post.
An introduction of Bollinger bands:
The indicator is developed by John Bollinger and the main purpose or the use of this indicator is to measure market volatility.
When the Bollinger Band is expanding, then it shows that the market volatility is great or yet increasing.
When the Bollinger Bands is contracting, then it indicates that the market is not volatile and most of the case the market is consolidating.
By understanding the basics above, you can use Bollinger Bands to trade at any direction/trend of the market easily.
The Forex Bollinger Bands Strategy Method:
Method 1: Trend Trading
We are going to use Bollinger Bands as a trend indicator and as a signal entry point. There are basically two steps needed to be done before entering a trade.
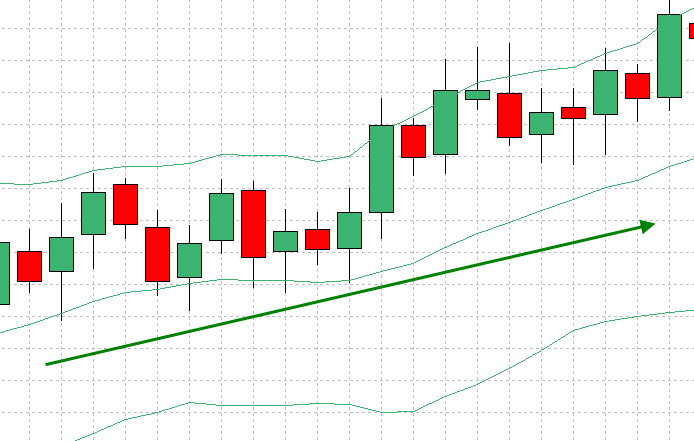
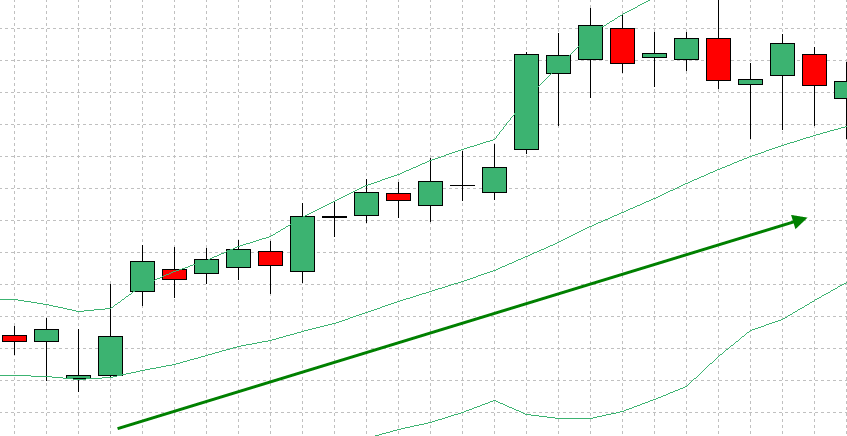
Step 1: Identify Trend
The Bollinger Bands consisted of 3 lines. However, in this occasion we only going to use the middle line to identify the trend. It acts the same like moving averages do.
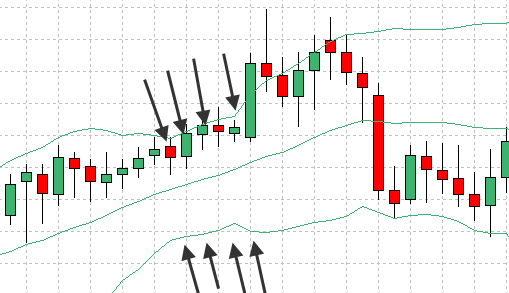
When the middle line move below the price, then it indicates that the price is trending up.
Example 1:
Example 2:
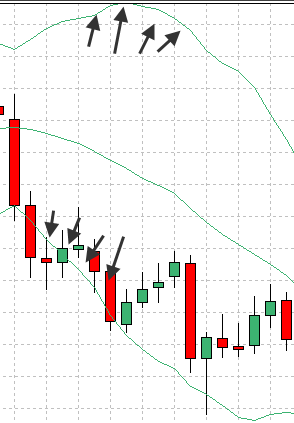
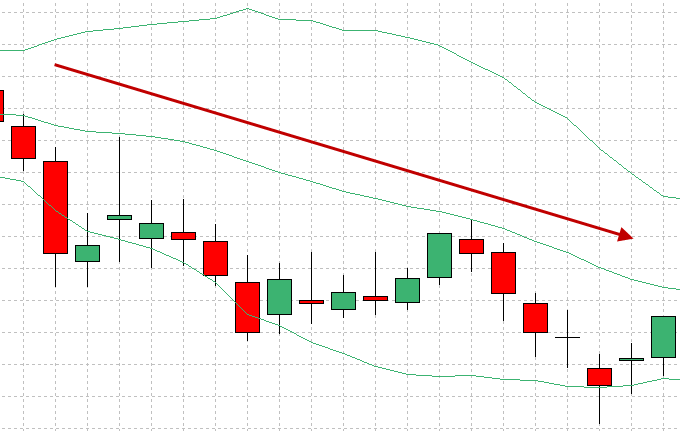
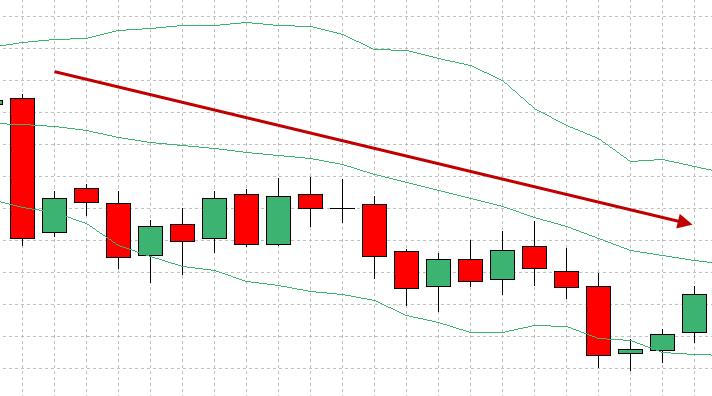
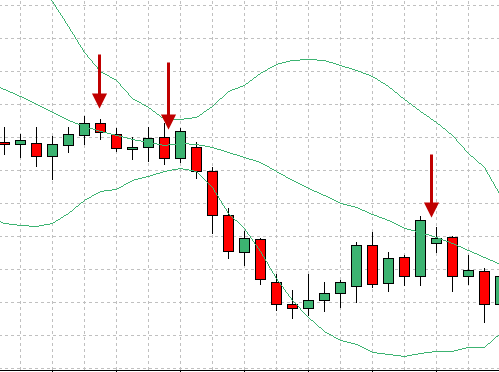
Whilst when the middle line moves above the price, then it indicates that the price is trending down.
Example 1:
Example 2:
 Once the first step is done then carries on to the next step.
 Once the first step is done then carries on to the next step.
Step 2: Buy or sell
So once you identify the trend…wait till the price touch the middle. The middle line acts the same as resistance or support line. Take a note here:
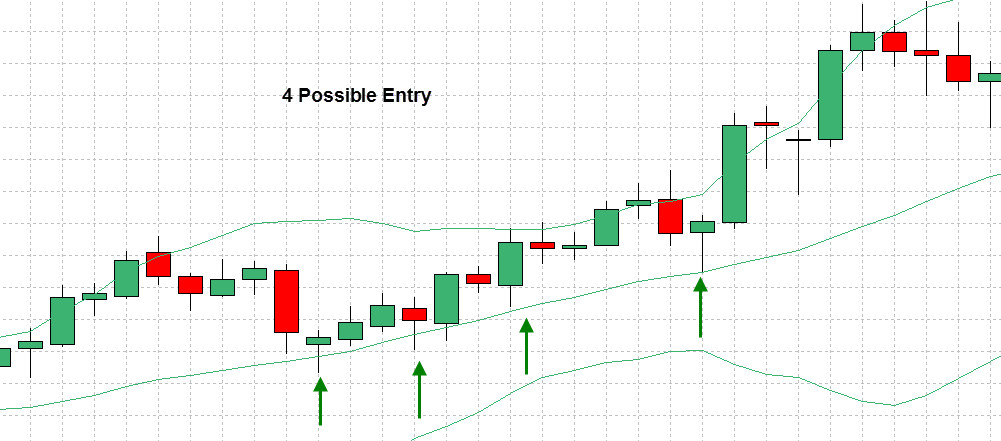
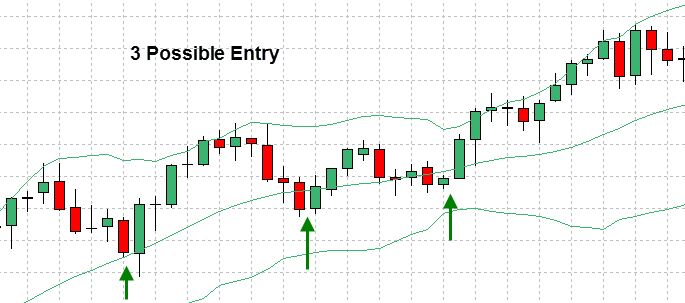
When the trend is up, wait till the price touch the middle line and prepare for buy.
Example 1:
 Example 2:
 Example 2:
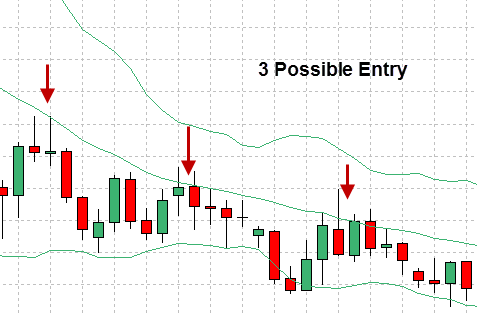
 When the trend is down, wait till the price touch the middle line and prepare for sell.
 When the trend is down, wait till the price touch the middle line and prepare for sell.
Example 1:
Example 2:
Method 2: No Trend Trading
Sometimes, the market does not move up or down. Instead, the market moves in a straight or horizontal direction.
How do I know the market moves sideway( not trending )?
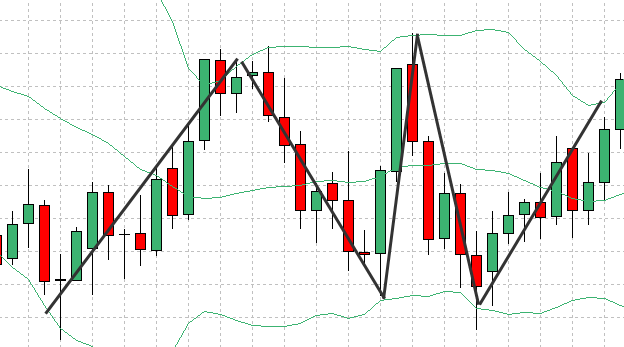
Easy, Use the Bollinger Band. When the Bollinger Bands is creates like a zigzag pattern then there you go, the price is sideway.
I like sideway market. Here is why. Usually, when it comes to sideway, the price is bouncing up and down when touching the upper and lower line of Bollinger Band.
The Middle Line usually noisy.
So here is the easy condition:
-
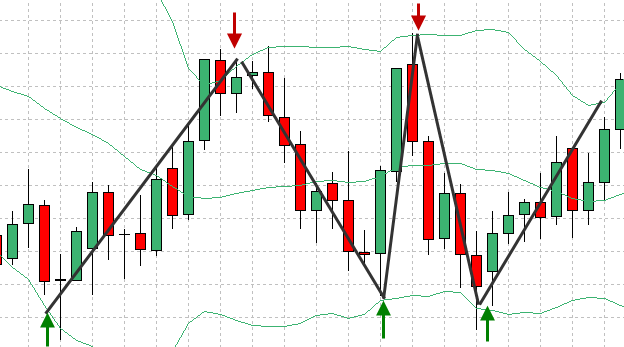
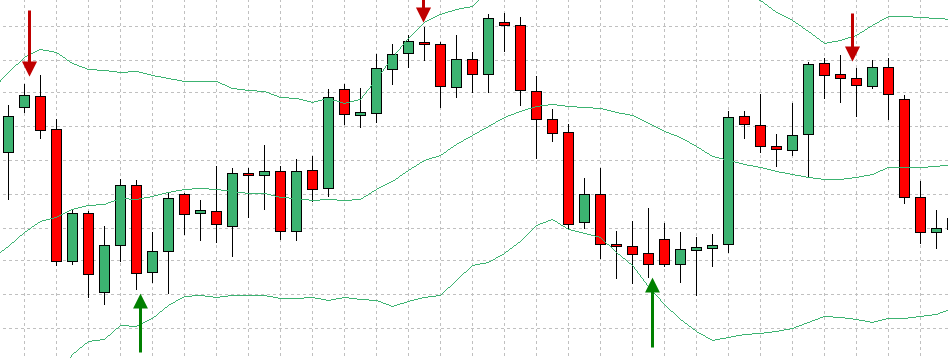
When the price touch the upper line, ready to sell.
-
When the price touch the lower line, ready to buy.
Example 1:
Example 2:
You might think that the Bollinger Bands principle is the same like support and resistance. In fact, yes it is. I really do recommend you to combine other price action signal such as candlestick pattern to apply this method. Take a look on this example:
Example:
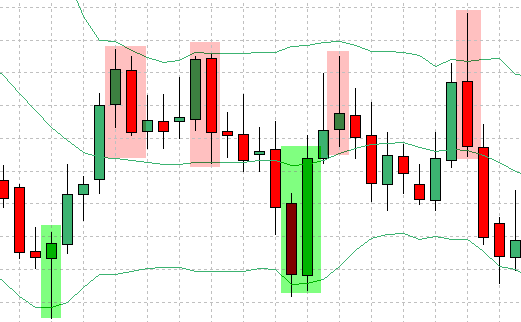
The green highlights are the bullish/buy pattern.
The red highlights are the bearish/sell pattern.
The more knowledge you learn about the candlestick pattern or about any sort of price action, the more hint you can get.
The Forex Bollinger Bands Strategy Method In A Nutshell:
So, here is a basic outline of what you’ll be doing with these methods:
-
Trend Trading: 1- Identify Trend 2- Wait till price touch the middle line and prepare for entry point.
-
No Trend Trading: 1- Sideway condition 2- Touch upper line = sell, Touch lower line=buy
***Extra tip: I did mention this already. Anyway, I recommend you to learn at least basic candlestick pattern to apply this methods so you know what you can expect the price is doing.
Last not least, I hope you enjoyed reading this short and simple Forex Bollinger Band Strategy. Do share and comment below if you are enjoying this. Thanks!
Best regards,
Tim Morris
admin @ ForexMT4Indicators.com
Recommended Forex Trading Broker
- Free $30 To Start Trading Instantly
- No Deposit Required
- Automatically Credited To Your Account
- No Hidden Terms

excellent sharing & good strategy 🙂
I like it and all the sharing in this site
Thanks! I’m glad that you like it. I will do my best to share more forex trading tips and strategies.
Heel overzichtelijk!
Top site voor beginner en gevorderde forex handelaar
dank je! deel deze forex strategie website met je vrienden 🙂
Awesome strategy.
Hi
I enjoyed it very much.
thank you .
I’m Mehdi from Iran