


Introduction to the Donchian Channels System Indicator
Price action traders identify trend direction based on the patterns of the price swings, whether price action is forming higher or lower swing highs and swing lows. The Donchian Channels System Indicator is a momentum indicator which is based on the same concept using breakouts from prior price swing extremes to detect momentum breakouts.
What is the Donchian Channels System Indicator?
The Donchian Channels System Indicator is a momentum indicator which was developed to help traders identify potential momentum breakouts.
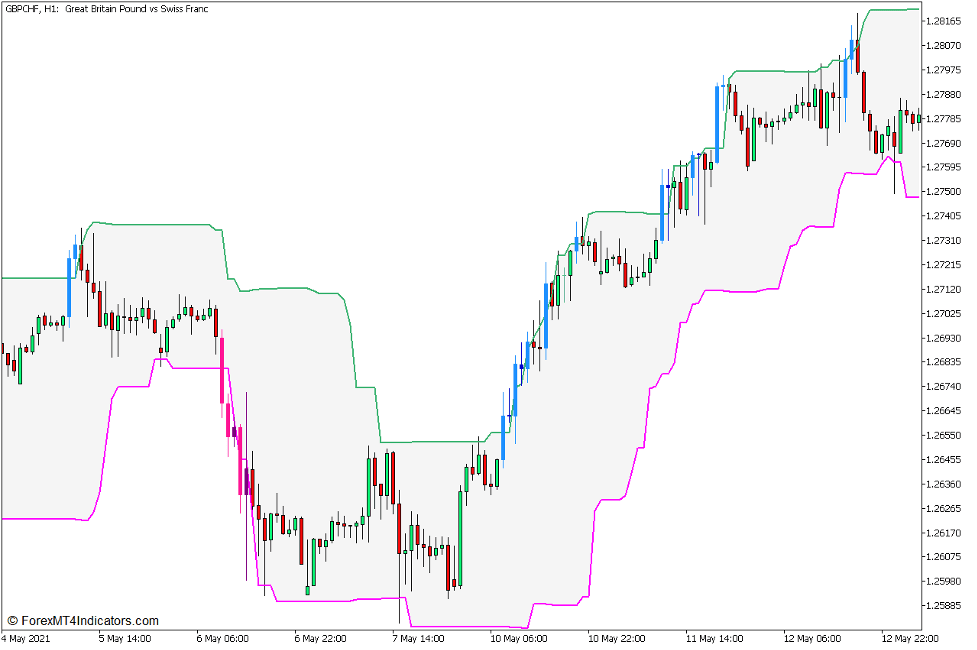
This indicator is a channel type of indicator. It plots two lines which envelopes price action. It plots a green line to represent the Upper Donchian Channel threshold and a magenta line to represent the Lower Donchian Channel threshold. The color of the candles also changes to indicate potential momentum breakouts. It plots a sky blue candle to indicate a bullish momentum breakout and a pink candle to indicate a bearish momentum breakout.
How the Donchian Channels System Indicator Works?
The Donchian Channels System Indicator has an algorithm which is very similar to the standard Donchian Channels Indicator with a slight modification.
Just like the basic Donchian Channels Indicator, the Donchian Channels System Indicator detects the highs and lows of the price range within a specified time window. This indicator is preset to detect the highs and lows of the price range over a 20-bar period, although this can be modified within the indicator settings. The highs of the range would be the basis for plotting the points of the Upper Donchian Channel line, while the lows of the range would be the basis for plotting the points of the Lower Donchian Channel line.
The modification that this indicator has is that it shifts the Donchian Channel lines that it plots forward. This is preset to shift the line forward by two periods, although this can also be modified within the indicator settings.
This shift allows the candlesticks to cross the lines whenever there is a strong momentum. The crossovers trigger the indicator to change the color of the candles to indicate a momentum breakout.
How to use the Donchian Channels System Indicator for MT5
The Donchian Channels System Indicator has a few options which can be modified within its settings.
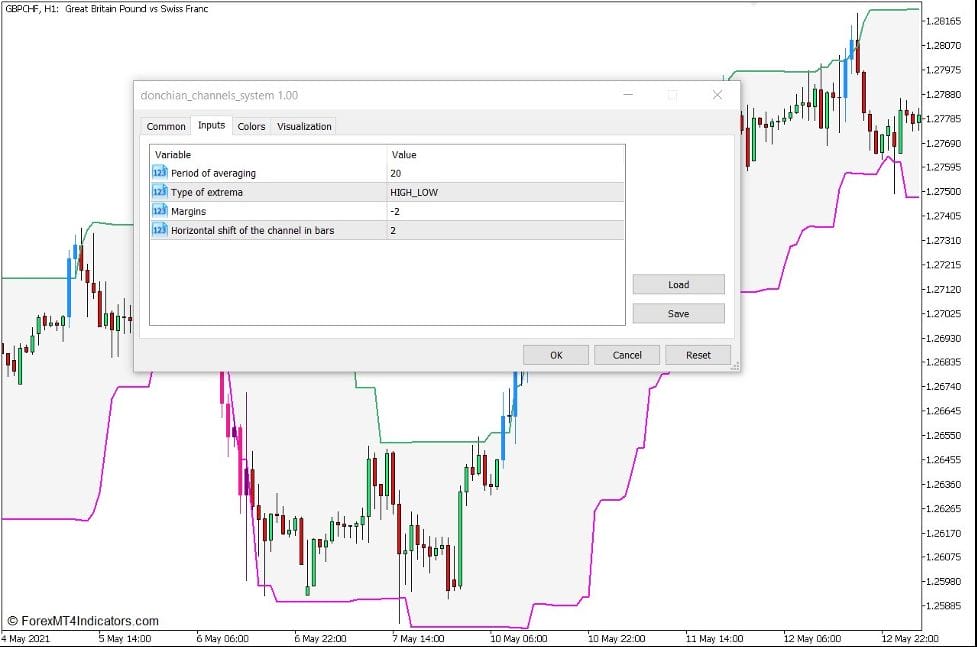
“Period of averaging” refers to the number of bars which the indicator would use to detect the highs and lows of the price range.
“Type of extreme” allows users to modify the basis of the upper and lower Donchian Channel lines.
“Margins” shift the Donchian Channel lines up and down.
“Horizontal shift…” modifies the number of periods the line would be shifted forward.
Buy Trade Setup
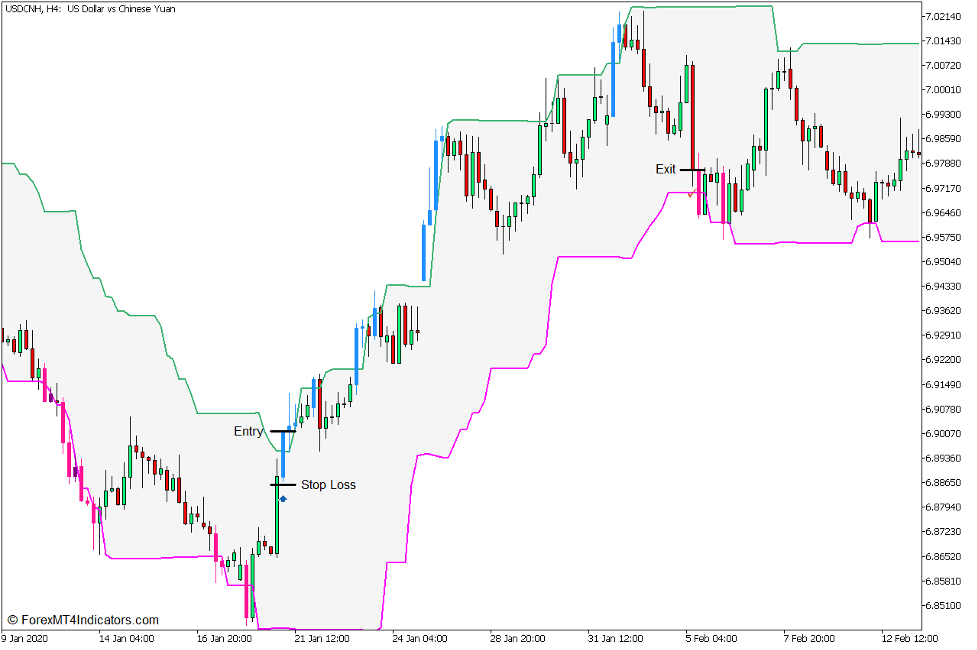
When to Enter?
Open a buy order on the confluence of a bullish momentum candle and a breakout above the upper Donchian Channel line.
When to Exit?
Close the trade as price action starts to create lower lows.
Sell Trade Setup
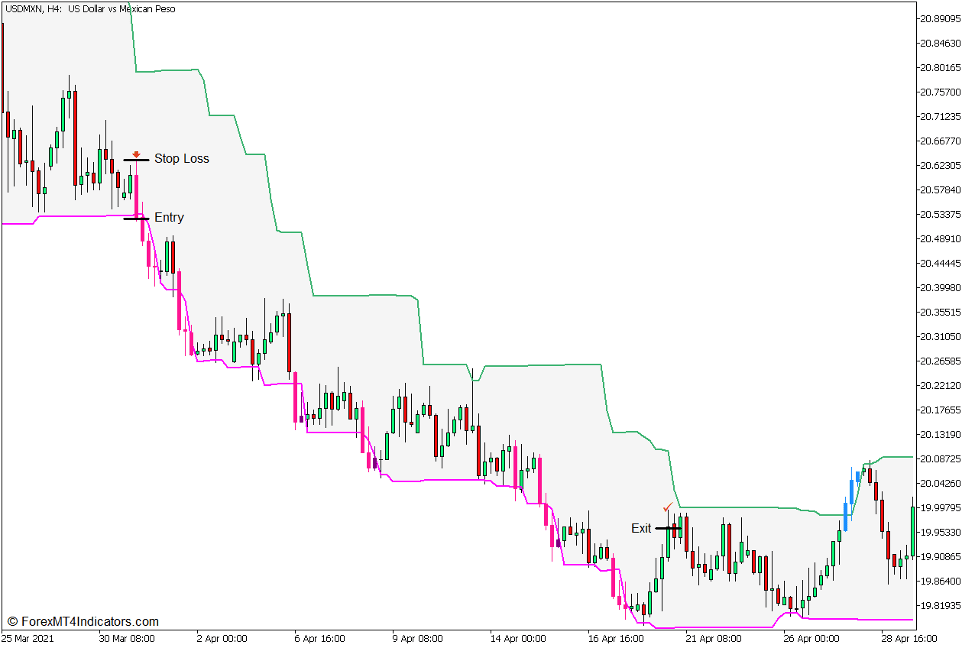
When to Enter?
Open a sell order on the confluence of a bearish momentum candle and a breakdown below the lower Donchian Channel line.
When to Exit?
Close the trade as price action starts to create higher highs.
Conclusion
This version of the Donchian Channels is an excellent modification of the standard Donchian Channels. The slight shift forward makes it useable as a momentum reversal signal indicator. The signals it produces is also very reliable.
Recommended MT5 Brokers
XM Broker
- Free $50 To Start Trading Instantly! (Withdraw-able Profit)
- Deposit Bonus up to $5,000
- Unlimited Loyalty Program
- Award Winning Forex Broker
- Additional Exclusive Bonuses Throughout The Year

>> Sign Up for XM Broker Account here <<
FBS Broker
- Trade 100 Bonus: Free $100 to kickstart your trading journey!
- 100% Deposit Bonus: Double your deposit up to $10,000 and trade with enhanced capital.
- Leverage up to 1:3000: Maximizing potential profits with one of the highest leverage options available.
- ‘Best Customer Service Broker Asia’ Award: Recognized excellence in customer support and service.
- Seasonal Promotions: Enjoy a variety of exclusive bonuses and promotional offers all year round.

>> Sign Up for FBS Broker Account here <<

(Free MT5 Indicators Download)
Click here below to download: