


Supports and Resistances are key levels in which traders should look out for. These are levels in which price tends to find it difficult to break through.
There are several scenarios which couple of scenarios which often take place on valid support and resistance areas. At times, price would break through such areas. This scenario is called a momentum breakout condition which can occur as a breakout from a resistance level or a breakdown from a support level. Often times, price would bounce off these levels. Price would often reverse back down as it hits a valid resistance level or bounce back up as it hits a valid support level. There are other scenarios which could occur such as a false breakout, in which case price would temporarily pierce the support or resistance level as if it would breakout, then reverse just as a regular bounce.
In any case, trading on support and resistance areas could be a valid trading strategy with a very good potential for profits because of the activity that usually occur on these levels. The question now is how do we find valid support or resistance levels?
There are different types of supports and resistances. There are the horizontal supports and resistances, which are like supply and demand zones that have shown to be respected by price. There are also the diagonal support and resistance lines, which are identified by connecting swing points and plotting trendlines.
In this strategy however, we will be looking at trading bounces off of a dynamic area of support or resistance using a custom technical indicator.
Dynamic supports and resistances are usually identified based on moving averages. These are moving average lines which price tends to bounce off from each time it is revisited.
Carter MA
Carter MA is a custom technical indicator which is based on a set of modified moving averages. Traders often use a variety of technical averages to represent the short-term, mid-term and long-term trends. Carter MA plots a set of widely used moving averages which many traders use a basis for making their trade decisions.
Carter MA plots five moving average lines with moving average periods as follows: 8, 21, 50, 100 and 200.
Traders can use these lines to identify the general direction of the trend based on how these moving average lines are stacked.
Traders can also the areas in between or near the lines to identify dynamic areas of supports and resistances where price tend to bounce off from.
Relative Strength Index
The Relative Strength Index (RSI) is a widely used momentum indicator which is an oscillator type of technical indicator. It identifies momentum based on an underlying computation of historical price movements.
The RSI plots a line that oscillates within the range of 0 to 100 with a median at level 50. An RSI line above 50 generally indicates a bullish trend bias, while an RSI line below 50 indicates a bearish trend bias.
It also typically has markers at level 30 and 70. Mean reversal traders identify an RSI line below 30 as an oversold market, while an RSI line above 70 indicates an overbought market. Both conditions are prime for mean reversal scenarios.
Momentum traders on the other hand could identify breaches of these levels as an indication of strong momentum. It all boils down to how price action is behaving as the RSI line reaches these levels.
Many traders also add the levels 45 and 55 to aid them in identifying trends. Level 45 acts as a support for the RSI line in a bullish trending market, while level 55 acts as a resistance for the RSI line in a bearish trending market.
Trading Strategy
Carter MA Dynamic Area Bounce Forex Trading Strategy is a simple trend following strategy based on the concept of bounces off dynamic support and resistance levels.
The dynamic support and resistance levels are based on the Carter MA lines. The areas adjacent to the blue moving average line acts as the dynamic areas of support or resistance. It is important to note that price action should have previously respected the area as support or resistance to be a valid dynamic support or resistance the next time price revisits the level.
The RSI line acts as a confirmation of the trend. The RSI line should respect levels 45 and 55 as support or resistance levels.
Trade signals are valid as price closes back outside the green line and the RSI line breaks out of levels 45 or 55 in the direction of the trend.
Indicators:
- Carter_MA
- Color #0: none
- Relative Strength Index
- Period: 19
Preferred Time Frames: 1-hour, 4-hour and daily charts
Currency Pairs: FX majors, minors and crosses
Trading Sessions: Tokyo, London and New York sessions
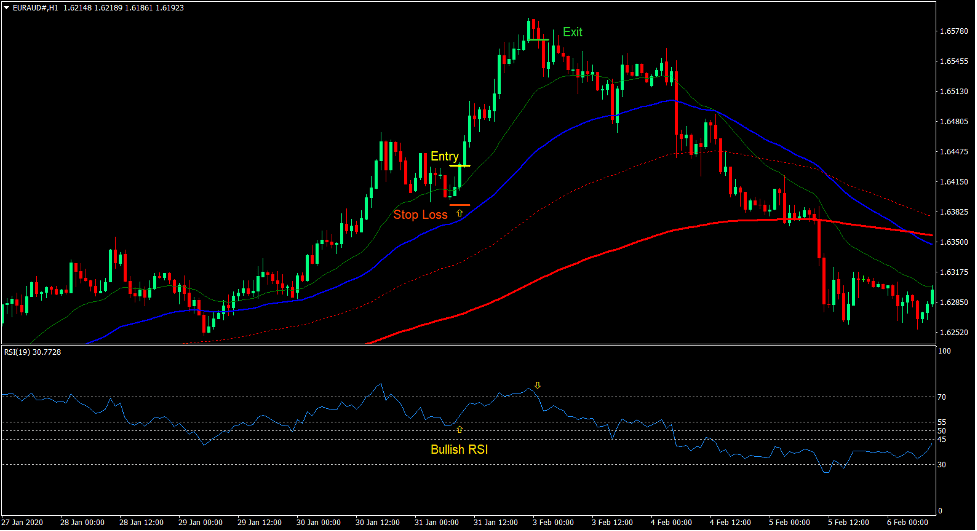
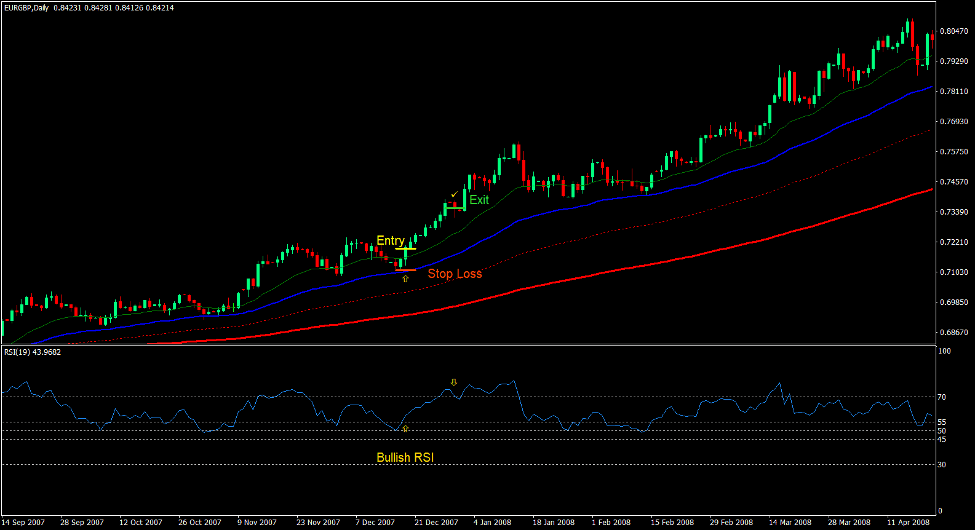
Buy Trade Setup
Entry
- The Carter MA lines should be stacked in the following order:
- Green line: top
- Blue line: second from the top
- Dotted red line: second from the bottom
- Solid red line: bottom
- Price should have previously bounced off the area adjacent to the blue line.
- Price should retrace back towards the area near the blue line.
- Price should close above the green line.
- The RSI line should cross above 55.
- Enter a buy order on the confirmation of these conditions.
Stop Loss
- Set the stop loss on a support level below the entry candle.
Exit
- Close the trade as the RSI line crosses back below 70 after a bullish momentum breakout.
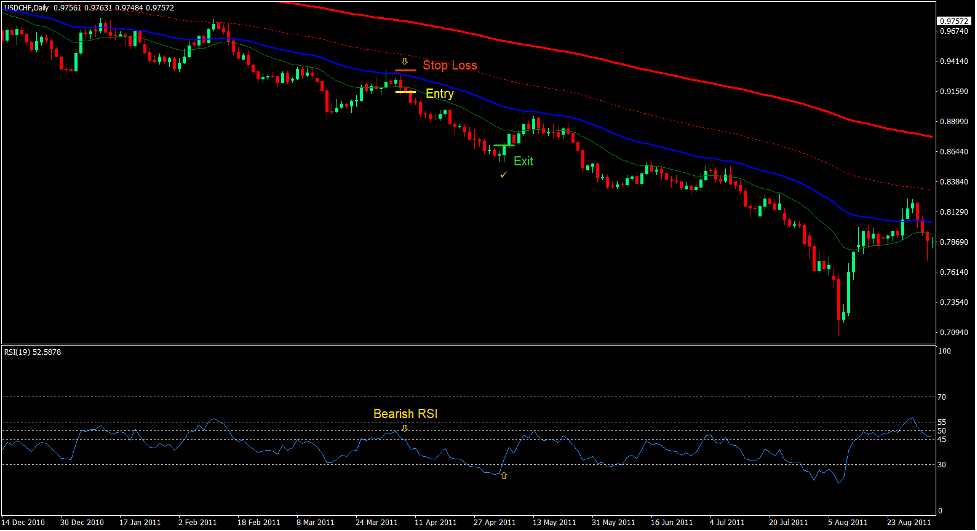
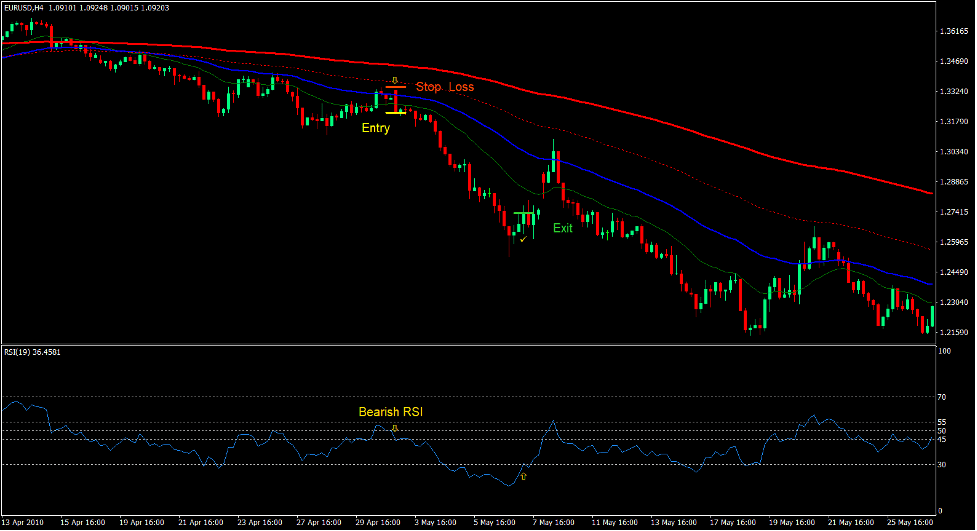
Sell Trade Setup
Entry
- The Carter MA lines should be stacked in the following order:
- Green line: bottom
- Blue line: second from the bottom
- Dotted red line: second from the top
- Solid red line: top
- Price should have previously bounced off the area adjacent to the blue line.
- Price should retrace back towards the area near the blue line.
- Price should close below the green line.
- The RSI line should cross below 45.
- Enter a sell order on the confirmation of these conditions.
Stop Loss
- Set the stop loss on a resistance level above the entry candle.
Exit
- Close the trade as the RSI line crosses back above 30 after a bearish momentum breakout.
Conclusion
This simple trend following strategy is a working strategy which many profitable traders use. In spite of its simplicity, the setups produced by this strategy tend to work really well.
The key to trading this strategy successfully is in finding a forex pair that is trending sufficiently. This can be identified based on the characteristics of price action, whether it is plotting higher or lower swing points.
Recommended MT4 Brokers
XM Broker
- Free $50 To Start Trading Instantly! (Withdraw-able Profit)
- Deposit Bonus up to $5,000
- Unlimited Loyalty Program
- Award Winning Forex Broker
- Additional Exclusive Bonuses Throughout The Year

>> Sign Up for XM Broker Account here <<
FBS Broker
- Trade 100 Bonus: Free $100 to kickstart your trading journey!
- 100% Deposit Bonus: Double your deposit up to $10,000 and trade with enhanced capital.
- Leverage up to 1:3000: Maximizing potential profits with one of the highest leverage options available.
- ‘Best Customer Service Broker Asia’ Award: Recognized excellence in customer support and service.
- Seasonal Promotions: Enjoy a variety of exclusive bonuses and promotional offers all year round.

>> Sign Up for FBS Broker Account here <<
Click here below to download: