


Trend Reversals Strategies and Breakout Trading Strategies do not always go together. Traders would seldom think about Breakout Trading when they are doing Trend Reversal Strategies and vice versa.
This is understandable because the two types of strategies are often placed on opposite sides of a spectrum. One is a type of strategy that aims to trade on a reversal of a trend or momentum, while the other aims to profit from momentum price movements breaking out from a support or resistance.
Trade setups that have certain elements of a trend reversal and momentum breakout are often the strategies that produce higher probability trades.
Awesome Kijun Tenkan Breakout Forex Trading Strategy is a trend reversal strategy that has elements of a trend reversal and a momentum breakout. Having both elements in one strategy significantly increases the likelihood of profiting from trades.
Kijun Tenkan Indicator
The Kijun Tenkan indicator is a trend following indicator based on the Ichimoku Kinko Hyo indicator. Both the Kijun-sen and Tenkan-sen are elements of the Ichimoku Kinko Hyo indicator and are predominantly the determining factors in identifying trade entries.
The Kijun-sen (Base Line), is the median of price for the past 26-periods. As such, the Kijun-sen is considered as a short- to medium-term trend indicator.
To compute for the Kijun-sen, the algorithm computes for the sum of the highest-high and lowest-low for the past 26-periods and divides the sum by two.
The Tenkan-sen or Conversion Line is computed by adding the highest-high and the lowest-low for the past 9-periods, the sum of which is divided by two. As such, the Tenkan-sen is considered as a short-term trend indicator based on the median of the last 9-periods.
Crossovers between the two lines are considered as high probability trend reversal signals. If the crossovers are aligned with the longer-term trend, or if is combined with another trading signal, trade signals tend to result in profits more often.
Awesome Oscillator
The Awesome Oscillator is a technical indicator used to measure momentum and trend direction.
This indicator computes for the difference between a 5-period Simple Moving Average (SMA) and a 34-period Simple Moving Average (SMA). However, the computation is not based on the close of the price candles but rather based on the midpoints of each period. The result is then plotted as an oscillator using histogram bars.
Positive bars generally indicate a bullish trend, while negative bars generally indicate a bearish trend. Crossovers from negative to positive or vice versa indicate a crossover between the two Simple Moving Average lines and would also indicate a probable trend reversal.
Aside from this, the indicator is also able to identify whether momentum is strengthening or weakening. The indicator changes color depending on the value of the current bar in relation to the previous bar. If the current bar has a bigger value than the previous bar, then the bar would be painted green. If the current bar has a lower value than the previous bar, then the bar would be painted red. In an uptrend, green bars indicate a stronger momentum, while in a downtrend, red bars indicate a stronger momentum.
Trading Strategy
This trading strategy provides trade signals based on breakouts from a diagonal support or resistance which is in line with an opposing trend direction. It also uses a couple of indicators to confirm the trend reversal based on confluences.
To trade this strategy, a diagonal support or resistance should be observable on the price chart. We should then wait for price to breakout of the support or resistance line with momentum. The strategy then confirms the trend reversal based on the confluence between the Kijun Tenkan indicator and the Awesome Oscillator.
The Kijun Tenkan indicator should have the Tenkan-sen (Conversion Line) crossover the Kijun-sen (Base Line) in the direction of the opposite trend.
On the Awesome Oscillator, the histogram bars should crossover zero closely aligned with the crossover on the Kijun Tenkan indicator.
Indicators:
- Kijun Tenkant (default settings)
- Awesome Signal (default settings)
Preferred Time Frames: 1-hour and 4-hour charts
Currency Pairs: major and minor pairs
Trading Sessions: Tokyo, London and New York sessions
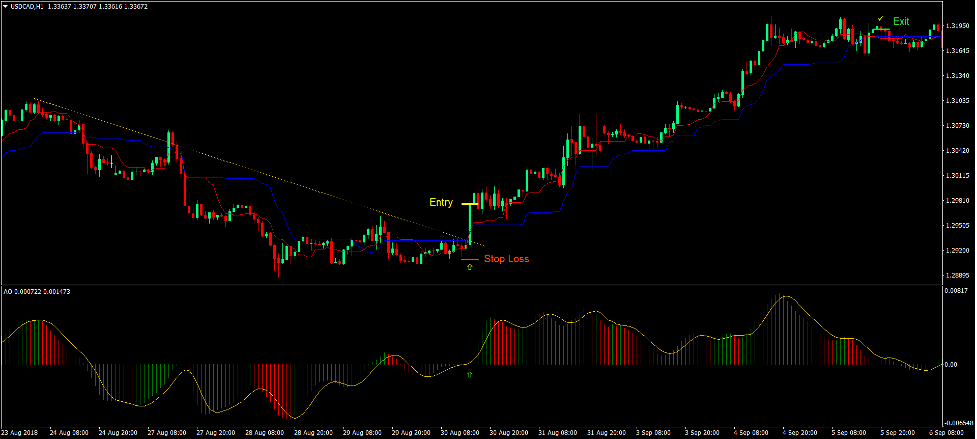
Buy Trade Setup
Entry
- Price should break above a diagonal resistance line.
- A bullish momentum candle should be observable near the breakout point.
- Price should cross above the Kijun-sen and Tenkan-sen lines.
- The Tenkan-sen (red) line should cross above the Kijun-sen (blue) line.
- The Awesome Oscillator bar should cross above zero.
- These bullish signals should be closely aligned.
- Enter a buy order on the confirmation of the conditions above.
Stop Loss
- Set the stop loss on the fractal below the entry candle.
Exit
- Close the trade as soon as the Tenkan-sen (red) line crosses below the Kijun-sen (blue) line.
- Close the trade as soon as the Awesome Oscillator crosses below zero.
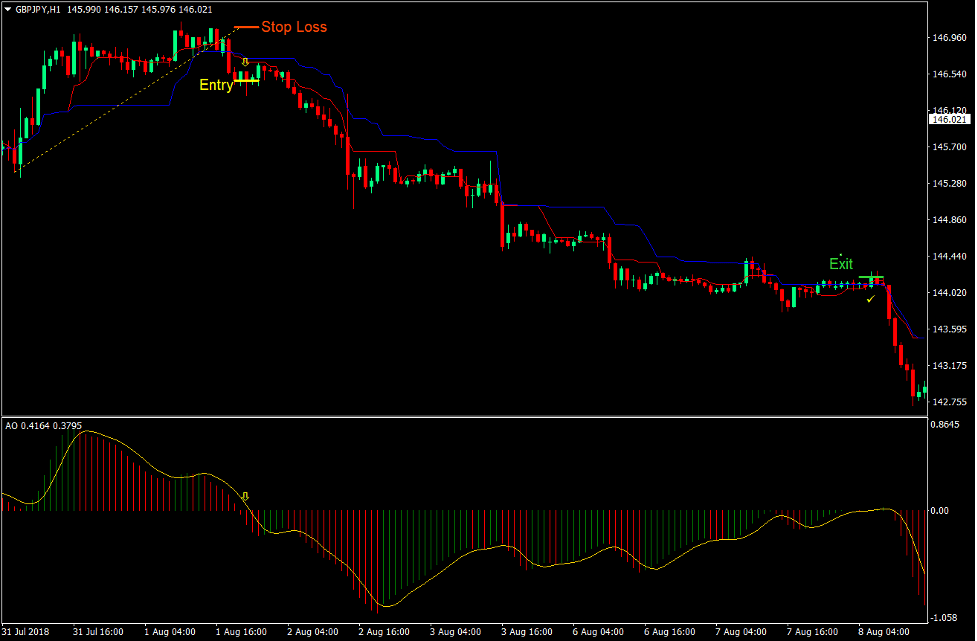
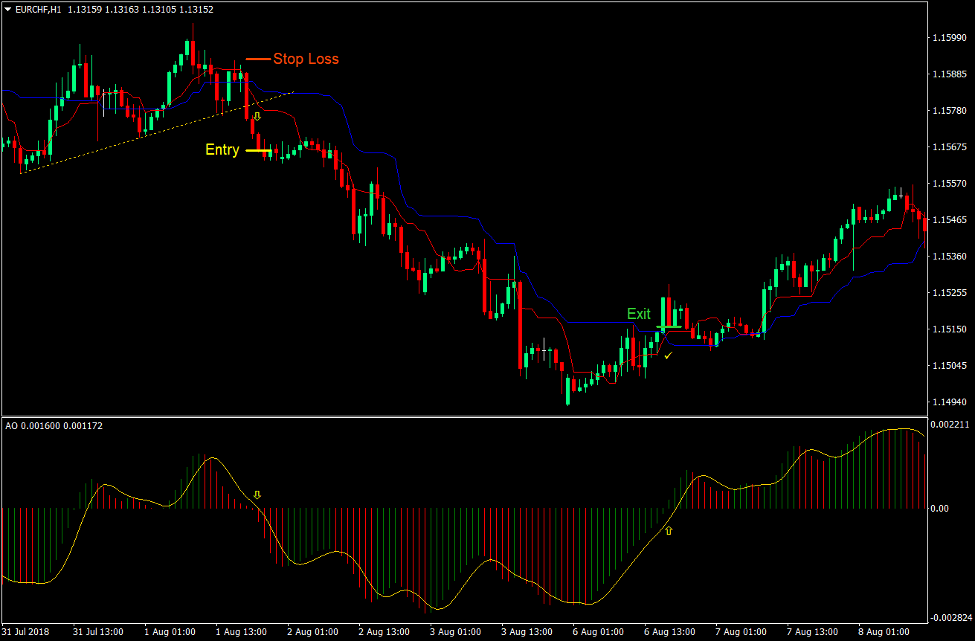
Sell Trade Setup
Entry
- Price should break below a diagonal support line.
- A bearish momentum candle should be observable near the breakout point.
- Price should cross below the Kijun-sen and Tenkan-sen lines.
- The Tenkan-sen (red) line should cross below the Kijun-sen (blue) line.
- The Awesome Oscillator bar should cross below zero.
- These bearish signals should be closely aligned.
- Enter a sell order on the confirmation of the conditions above.
Stop Loss
- Set the stop loss on the fractal above the entry candle.
Exit
- Close the trade as soon as the Tenkan-sen (red) line crosses above the Kijun-sen (blue) line.
- Close the trade as soon as the Awesome Oscillator crosses above zero.
Conclusion
Trend reversal strategies based on breakouts on its own are some of the most profitable trading setups. It allows traders to gain so much while risking only so little. This is what makes reversal breakouts so profitable.
However, the most common problem when trading reversal breakouts is accuracy. This is because identifying supports and resistances as well as breakouts is highly subjective.
This strategy aims to increase the accuracy of such trading strategy by incorporating trend reversal signals from two high probability trend following indicators. As a result, the strategy retains its high yield nature while at the same time increasing the win rate.
Recommended MT4 Brokers
XM Broker
- Free $50 To Start Trading Instantly! (Withdraw-able Profit)
- Deposit Bonus up to $5,000
- Unlimited Loyalty Program
- Award Winning Forex Broker
- Additional Exclusive Bonuses Throughout The Year

>> Sign Up for XM Broker Account here <<
FBS Broker
- Trade 100 Bonus: Free $100 to kickstart your trading journey!
- 100% Deposit Bonus: Double your deposit up to $10,000 and trade with enhanced capital.
- Leverage up to 1:3000: Maximizing potential profits with one of the highest leverage options available.
- ‘Best Customer Service Broker Asia’ Award: Recognized excellence in customer support and service.
- Seasonal Promotions: Enjoy a variety of exclusive bonuses and promotional offers all year round.

>> Sign Up for FBS Broker Account here <<
Click here below to download: