


Technical Analysis is usually compartmentalized by traders into two types. On one hand, there are traders who rely solely on technical indicators. On the other hand, there are also traders who loathe technical indicators and believe that price action on a naked chart is the best way to trade the market.
Truth is none of them are wrong. Trading is a science and an art. Strategies are subjective depending on how a trader views a market. It all boils down to what works for a trader.
Both types of strategies also have an advantage and disadvantage.
The advantage of technical indicators is that indicators are very objective. Decisions are based on hard numbers and rules. In fact, trading based on algorithmic rules is already proven to be profitable. Trading robots use such rules and there are robots that could turn in a profit consistently. The disadvantage of technical indicators is that most are lagging. This leads traders to take trades late causing them to enter and exit trades at a worse price.
Traders who trade on price action and naked charts believe that trading this way gives them a strategy with no lag. However, nothing in the market is current except the current bid and offer price. Candlestick patterns are still based on historical prices. Still, price action has much lesser lag compared to indicators. It also provides information on how the market thinks about the current price based on how the patterns are formed.
Advanced Bollinger MACD Forex Trading Strategy uses both types. It makes use of technical indicators to identify possible trade entries while at the same time considering the type of patterns formed as the signal from the technical indicators are generated.
Advanced Bollinger Bands
The Bollinger Band is a versatile technical indicator. It identifies trend direction, momentum, volatility, and overbought or oversold price conditions. This indicator provides all this information using three lines.
The middle line of the classic Bollinger Bands is based on a 20-period Simple Moving Average (SMA). Two lines are then drawn above and below the middle line forming a channel. The upper and lower lines are derived from the middle line by computing for the standard deviation of price movements compared to the 20 SMA.
Because the outer bands are based on a standard deviation of price movements, the band tends to contract during market conditions with low volatility and expands during an influx of volume and volatility. Price breaching the bands could indicate a strong momentum, while price rejecting the outer lines could signal a probable mean reversal.
The middle line of the Bollinger Band could also be used just as a standard Simple Moving Average. Trend could be based on how the line is sloping. It could also be used as a dynamic support or resistance line where price could bounce off.
Advanced Bollinger Bands is a modified Bollinger Band which allows more control over how the lines are drawn. Traders could modify the type of moving average, the basis of price being applied to the computation, and much more.
MACD Signals
The classic Moving Average Convergence and Divergence (MACD) is based on the difference between a 12-period and 26-period Exponential Moving Average. It is then displayed as an oscillator that becomes positive during an uptrend and negative during a downtrend. A second line, called the signal line, is then derived from the MACD line. The signal line is a Simple Moving Average (SMA) of the MACD line. Trade signals are then generated based on the crossing over of the MACD line and the signal line.
MACD Signals is modified version of the classic MACD. It allows more control for traders by allowing traders to tweak the type of moving average line used on each parameter. It could also be set to indicate trade signals generated by the MACD.
The MACD Signals is displayed as an oscillating histogram. Positive bars indicate a bullish trend while negative bars indicate a bearish trend. Trade signals could be generated based on the crossing of the bars over its midline.
Trading Strategy
This trading strategy identifies possible trade setups based on the crossing over of a 5-period Simple Moving Average (SMA) line and the midline of the Bollinger Bands. These signals should be in confluence with the signals generated by the MACD Signals indicator.
Trades should first be filtered based on the direction of the long-term trend. To do this, we will be using a 200-period Simple Moving Average (SMA). Trend direction are simply based on the location of price in relation to the 200 SMA, as well as the slope of the 200 SMA line.
Then, we will be waiting for a confluence of the crossover of the 5 SMA line and midline of the Bollinger Band and the trend reversal signal generated by the MACD bars.
Trades are then confirmed based on the type of price action and candlestick patterns occurring around significant areas on the Bollinger Bands. It could be an indication of price rejection of the outer bands or a strong momentum as price crosses over the midline.
Indicators:
- 200 SMA (Brown)
- 5 SMA (Green)
- advanced-bollinger_bands (default setting)
- MACD_Signals
- MAFast: 6
- MASlow: 15
- MASignal: 1
Preferred Time Frames: 1-hour, 4-hour and daily charts
Currency Pairs: major and minor pairs
Trading Sessions: Tokyo, London and New York sessions
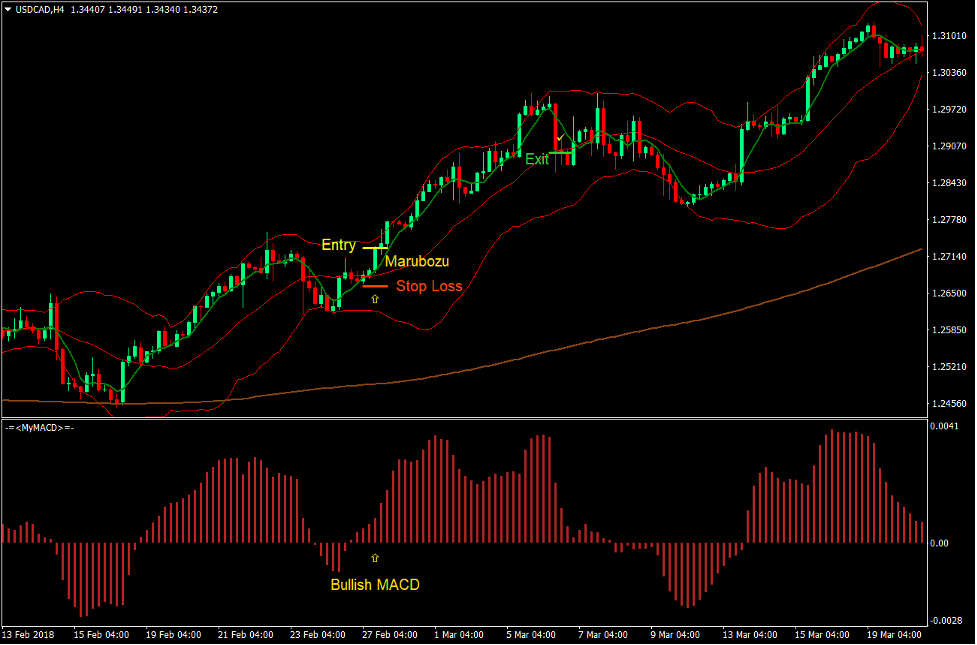
Buy Trade Setup
Entry
- Price should be above the 200 SMA line.
- The 200 SMA line should be sloping up.
- The 5 SMA line should cross above the midline of the Bollinger Band.
- Price action should show bullish patterns and indications.
- Enter a buy order on the confirmation of these conditions.
Stop Loss
- Set the stop loss on the fractal below the entry candle.
Exit
- Close the trade as soon as price closes below the midline of the Bollinger Band.
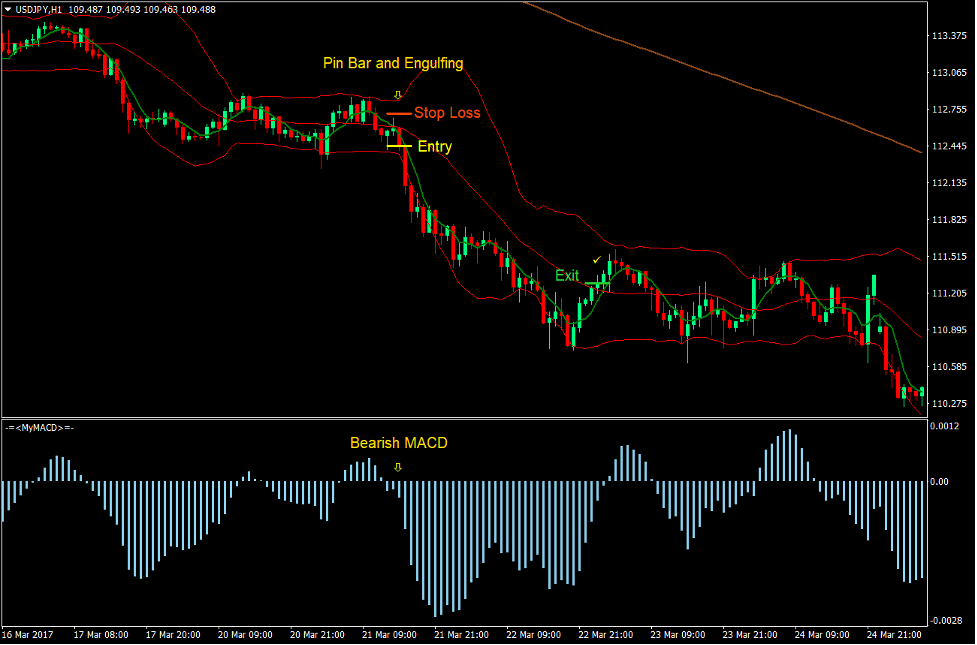
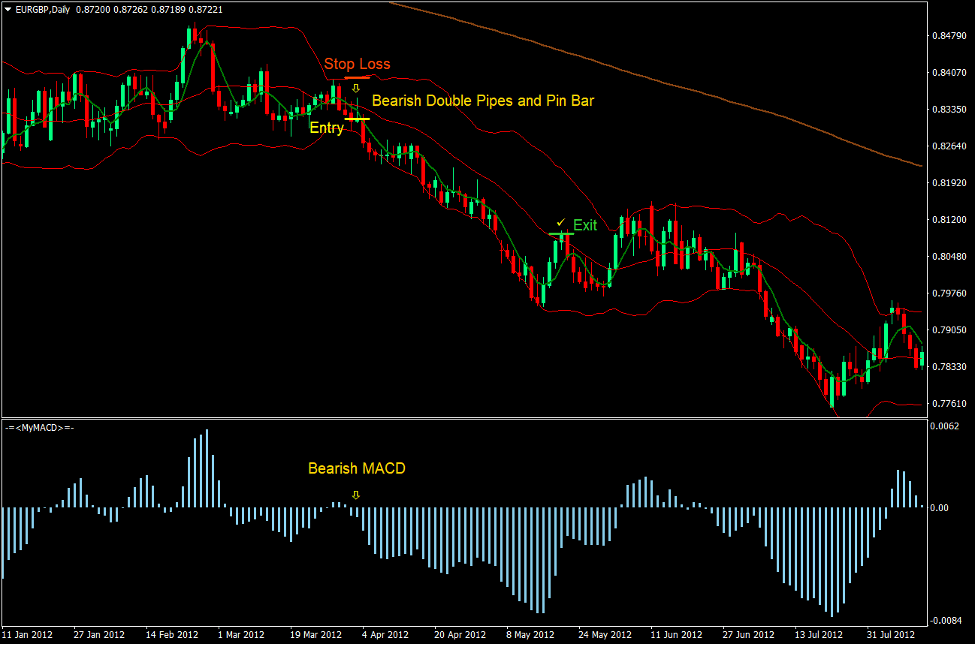
Sell Trade Setup
Entry
- Price should be below the 200 SMA line.
- The 200 SMA line should be sloping down.
- The 5 SMA line should cross below the midline of the Bollinger Band.
- Price action should show bearish patterns and indications.
- Enter a sell order on the confirmation of these conditions.
Stop Loss
- Set the stop loss on the fractal above the entry candle.
Exit
- Close the trade as soon as price closes above the midline of the Bollinger Band.
Conclusion
This trading strategy works well when used with a sound technical analysis.
There are a lot of traders who use price action and Bollinger Bands alone to identify trade entries and are making money out of the market.
This strategy is an improved version of the traditional Bollinger Band strategy because it filters trades based on the long-term trend and confirms trend reversals based on the MACD.
The key to trading this strategy profitably is in being proficient with price action and zooming out to identify the long-term trend more clearly together with the support and resistance lines.
Recommended MT4 Brokers
XM Broker
- Free $50 To Start Trading Instantly! (Withdraw-able Profit)
- Deposit Bonus up to $5,000
- Unlimited Loyalty Program
- Award Winning Forex Broker
- Additional Exclusive Bonuses Throughout The Year

>> Sign Up for XM Broker Account here <<
FBS Broker
- Trade 100 Bonus: Free $100 to kickstart your trading journey!
- 100% Deposit Bonus: Double your deposit up to $10,000 and trade with enhanced capital.
- Leverage up to 1:3000: Maximizing potential profits with one of the highest leverage options available.
- ‘Best Customer Service Broker Asia’ Award: Recognized excellence in customer support and service.
- Seasonal Promotions: Enjoy a variety of exclusive bonuses and promotional offers all year round.

>> Sign Up for FBS Broker Account here <<
Click here below to download: