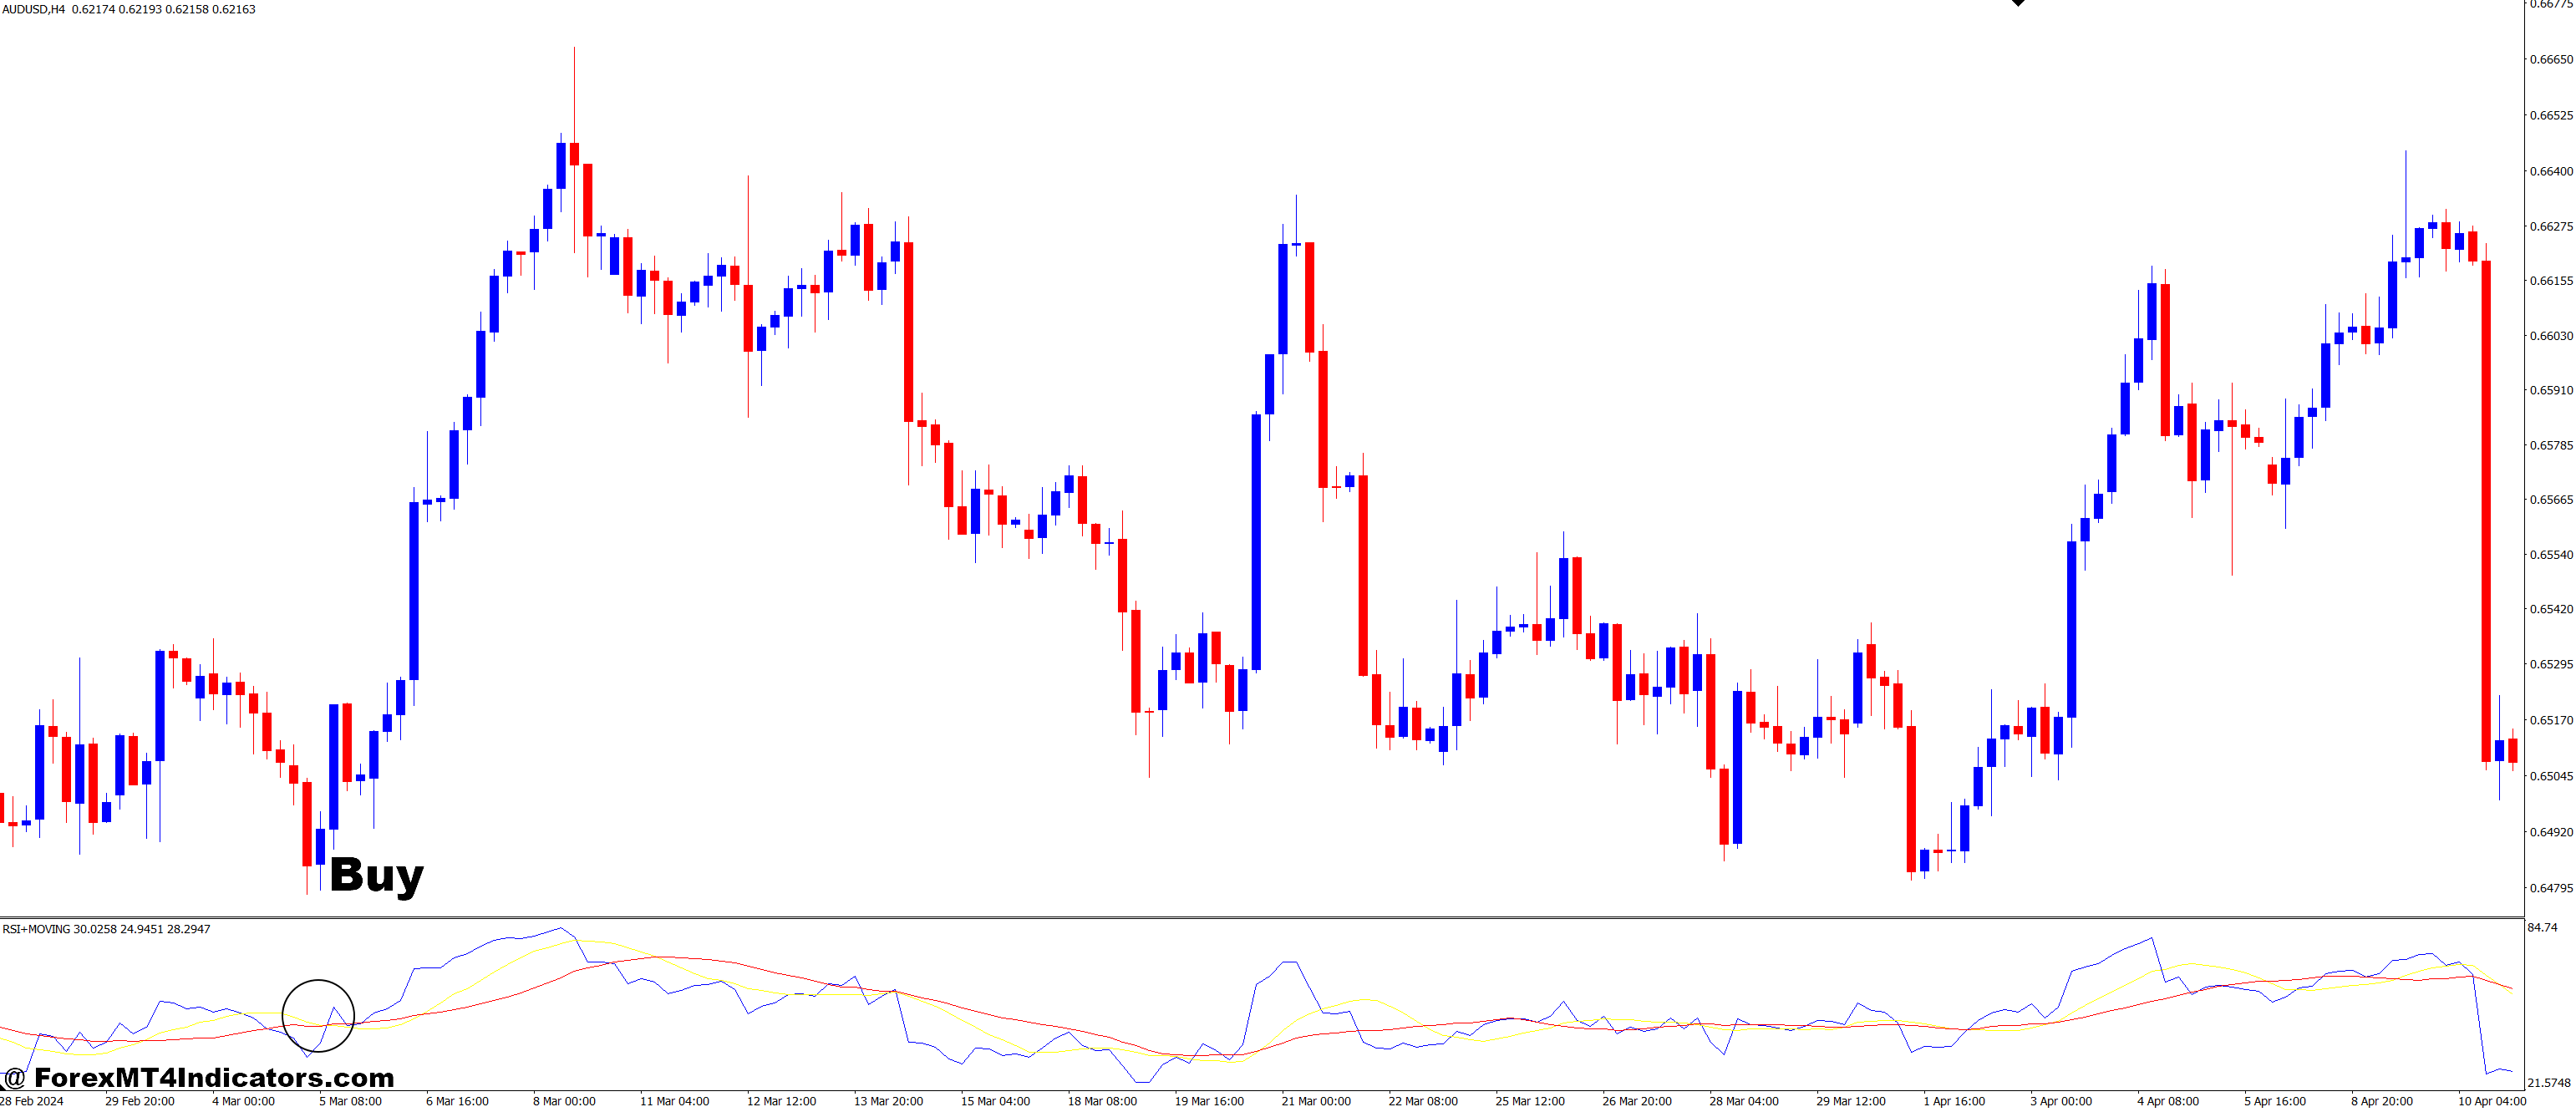
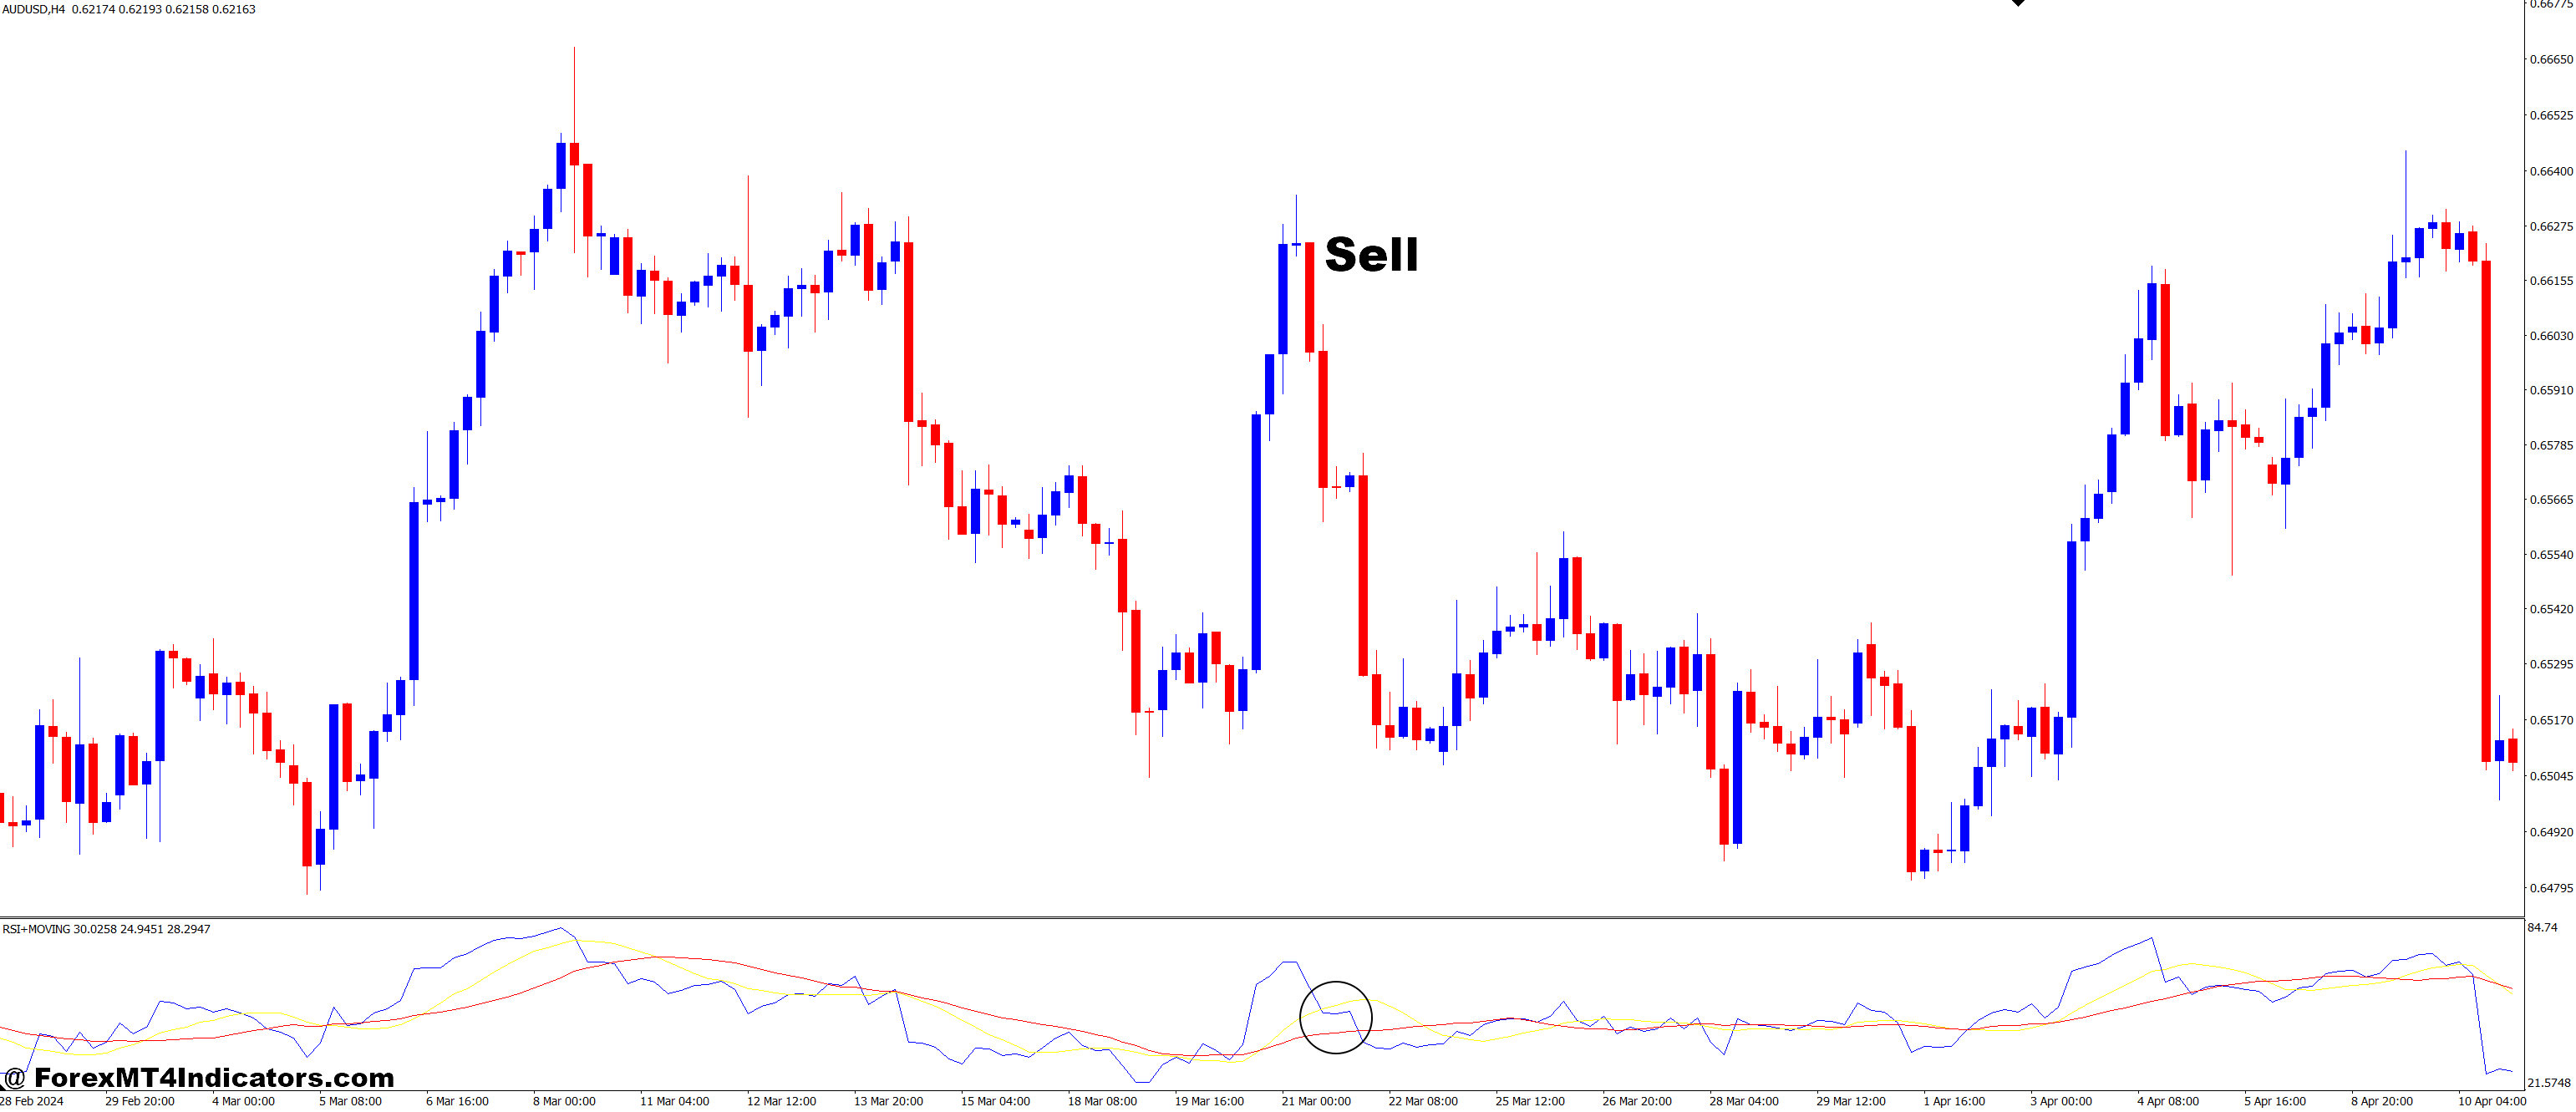
This custom indicator combines the Relative Strength Index (RSI) and a Moving Average (MA) into one simple chart tool on MetaTrader 4. The RSI measures momentum—how fast and strongly the price is moving—while the MA helps show the overall direction or trend. By using both together, traders get a clearer picture of when to enter or exit trades. It filters out a lot of noise and false signals that often mislead beginners.
How It Works and Why Traders Love It
When the RSI hits extreme levels (like overbought or oversold) and the price crosses the Moving Average, it often signals a strong trading opportunity. For example, if the RSI is below 30 (oversold) and the price moves above the MA, it could mean the trend is changing upward. Many traders use this setup to catch early moves and avoid late entries. It’s also handy for confirming trend strength before jumping in, making it easier to plan trades with less stress.
Benefits for New and Experienced Traders
This indicator is beginner-friendly but also useful for advanced traders. It helps newbies avoid overtrading and teaches them how to read momentum with trend direction. Experienced traders often use it to fine-tune their entries, especially in sideways or choppy markets. It’s easy to install on MT4 and doesn’t clutter your chart. Instead, it simplifies your view and helps focus only on high-probability setups.
How to Trade with RSI + MOVING AVERAGE MT4 Indicator
Buy Entry
- RSI drops below 30 (oversold zone), showing the price is too low.
- Price starts to move above the Moving Average line.
- RSI begins to rise back above 30, confirming upward momentum.
- Wait for a bullish candlestick close above the MA for extra confirmation.
- Optional: Check a higher time frame to confirm the overall uptrend.
Sell Entry
- RSI climbs above 70 (overbought zone), showing the price is too high.
- Price starts to move below the Moving Average line.
- RSI begins to fall below 70, signaling bearish momentum.
- Wait for a bearish candlestick close below the MA for added confirmation.
- Optional: Confirm overall downtrend on a higher time frame before entering.
Conclusion
The RSI + Moving Average MT4 Indicator offers a smart combo of momentum and trend analysis that can boost trading results. Whether you’re just starting out or already deep into the market, this tool can make your decisions clearer and more confident. It’s a small upgrade to your chart, but a big step for your trading strategy.
Recommended MT4/MT5 Broker
XM Broker
- Free $50 To Start Trading Instantly! (Withdraw-able Profit)
- Deposit Bonus up to $5,000
- Unlimited Loyalty Program
- Award Winning Forex Broker
- Additional Exclusive Bonuses Throughout The Year
- Exclusive 90% VIP Cash Rebates for all Trades!
Already an XM client but missing out on cashback? Open New Real Account and Enter this Partner Code: VIP90
(Free MT4 Indicators Download)

Enter Your Email Address below, download link will be sent to you.


