


SSRC 132 Forex Scalping Strategy
Scalp with a long-term trend!
Many professional day traders and scalpers approach trading by aligning themselves with the bigger picture trend while making profit on the minor gyrations of the market. Although this is not required but it is a very smart thing to do. Going with a longer-term trend while trading on the smaller gyrations would improve the probability of a trade setup being successful. But how should we do it?
Some traders do this by looking at a bigger timeframe. For example, if scalping on the minute chart, some traders would zoom out to maybe the 15-minute or 1-hour chart. Some day traders, when trading on the 5-minute chart or 15-minute chart would look at the 1-hour, 4-hour or maybe even the daily chart. Some would just zoom out to the smallest candles possible to fit as much of it on the screen and get a feel on the general direction of the trade. These are just a few of the ways looking at the long-term trend is done. There are definitely more ways to do this.
Long-Period Moving Averages for Longer-Term Trend
One of the more simplistic ways to determine the long-term trend is by using a moving average that takes into account more candles. This could be a 100, 200 or even 500 period moving average. These are just some of the more widely used moving averages for longer-term trends.
Determining the trend using these moving averages is typically done by determining the location of price in relation to the moving average. If price is above it, then the long-term trend is said to be bullish. If it is below it, then bearish.
By using this method, it is more objective and is easier to determine the long-term trend based on rules instead of relying on gutfeel. It also allows the trader to look at just one chart and have an idea of what the long-term trend is indicating.
Trading Strategy Concept
This strategy uses a 132-period Exponential Moving Average (EMA) as a basis to determine the long-term trend, which serves as a filter.
If price is above the 132 EMA, we will consider the market as bullish on the long-term. As such, we will only be taking buy trades. If price is below it, then the market is considered bearish, and only sell trades will be taken.
Signals will be determined by the SSRC custom indicator. The SSRC indicator is an oscillating indicator which moves around a midline on zero. It is a bounded indicator with an overbought and oversold marker at +/- 0.75 and 0.9, and a limit at +/- 1.3. This oscillating indicator also draws very smoothly. It also tends to flatten out when the market seems too bullish or bearish and only starts to bend when the trend is about to end.
We will be taking trades in the direction of the 132 EMA when the market is overextended based on the SSRC indicator. The entry signal is taken when the SSRC line crosses back from an overextended area to the +/- 0.9 mark. The trade is then exited when the SSRC line starts to bend back.
Indicators:
- 132-period Exponential Moving Average (gold)
- SSRC
Timeframe: 5-minute chart
Trading Session: any
Currency Pair: any
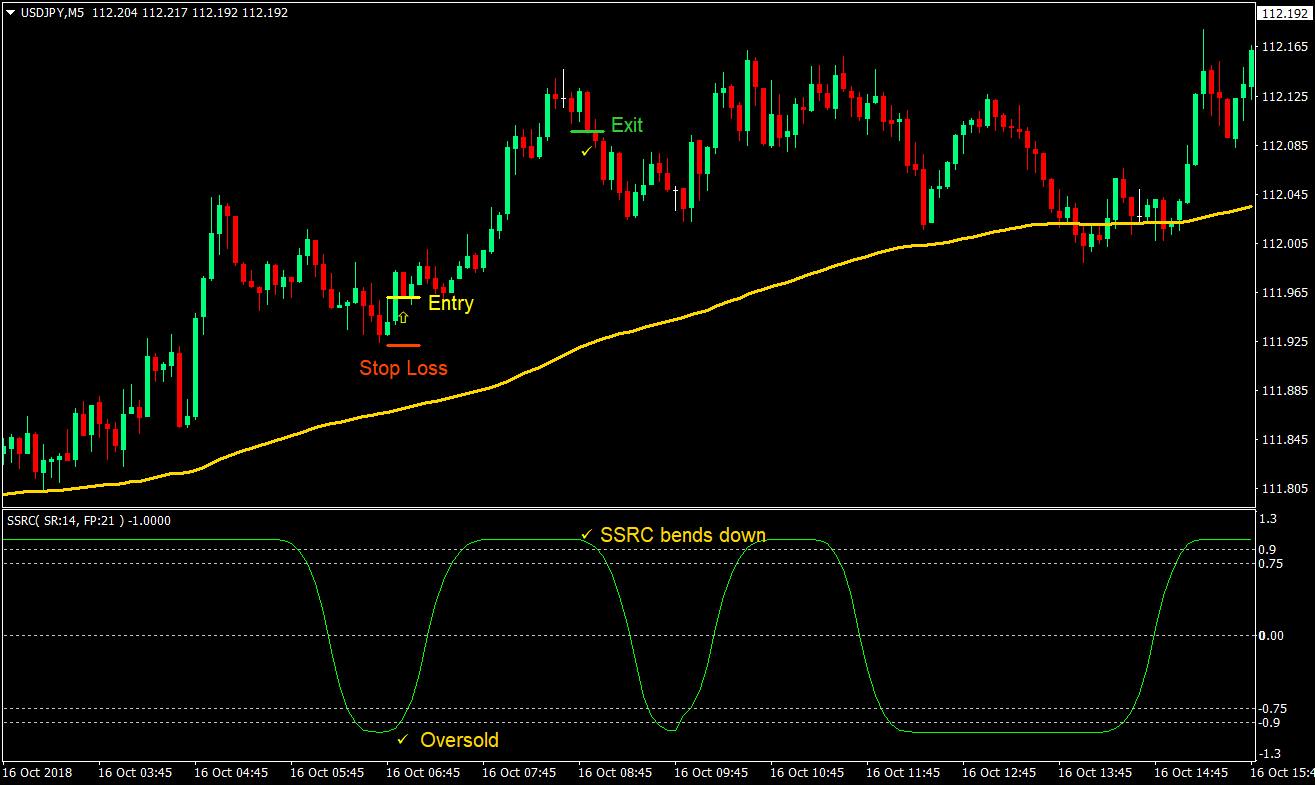
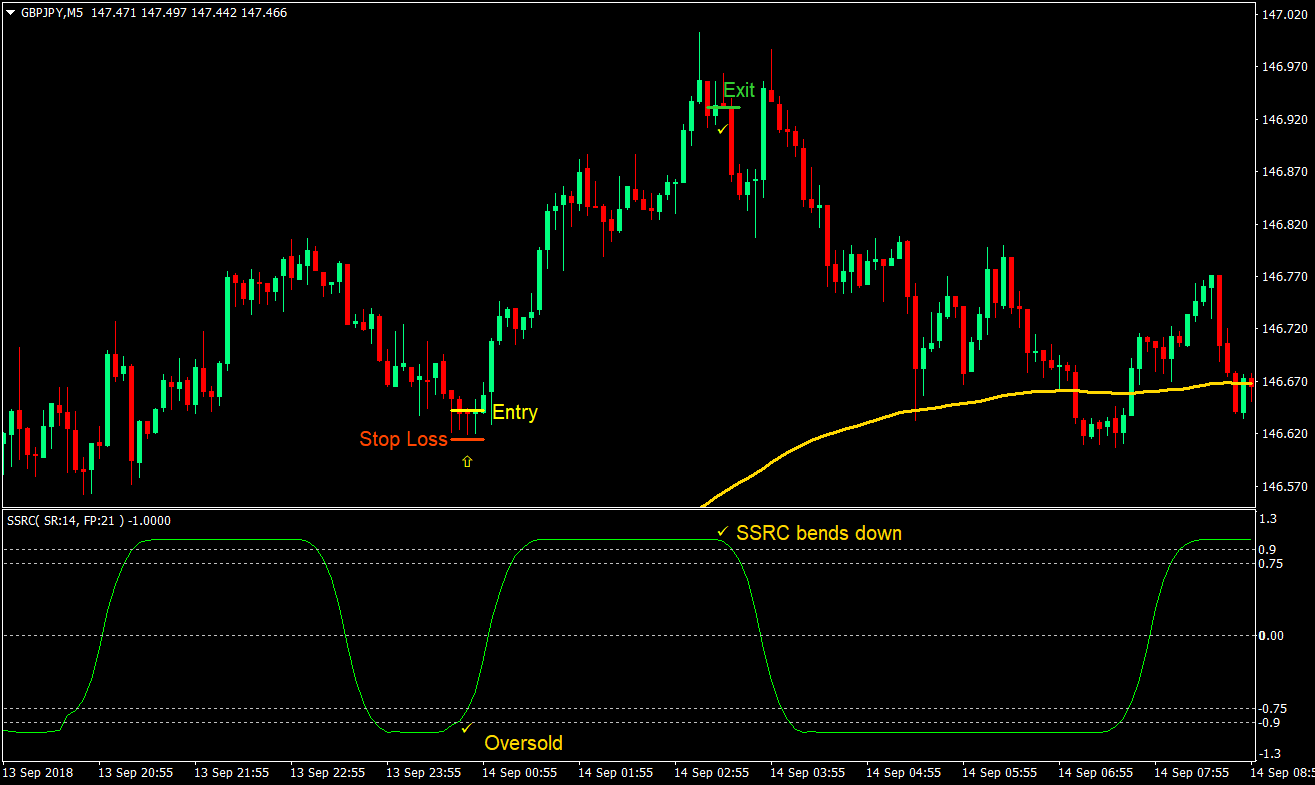
Buy (Long) Trade Setup
Entry
- Price should be above the 132 EMA
- Price should start to retrace towards the 132 EMA
- Wait for the SSRC line to oversold as price retraces
- Wait for the SSRC line to cross above the -0.9 mark
- Enter a buy order on the confluence of the above rules
Stop Loss
- Set the stop loss at the nearest support below the entry candle
Exit
- Close the trade as soon as price bends back down
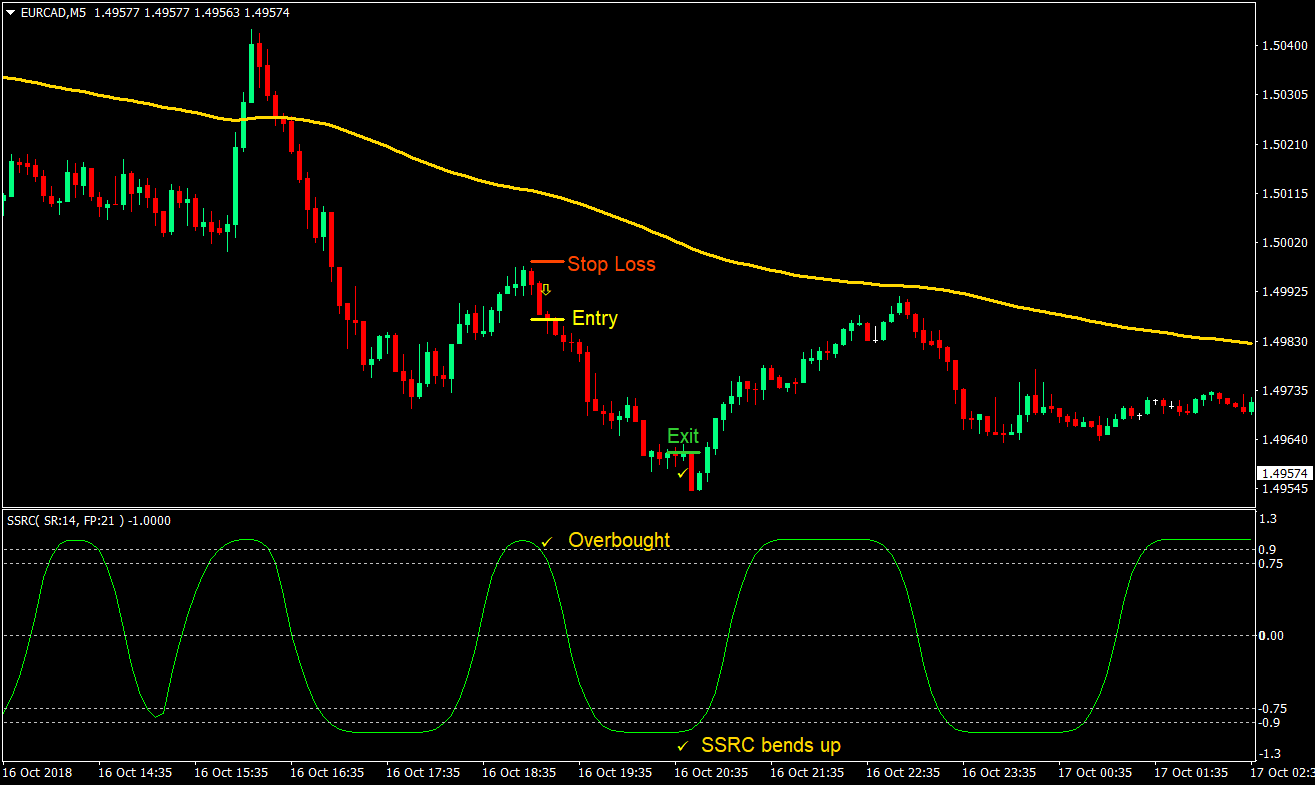
Sell (Short) Trade Setup
Entry
- Price should be below the 132 EMA
- Price should start to retrace towards the 132 EMA
- Wait for the SSRC line to overbought as price retraces
- Wait for the SSRC line to cross below the +0.9 mark
- Enter a sell order on the confluence of the above rules
Stop Loss
- Set the stop loss at the nearest resistance above the entry candle
Exit
- Close the trade as soon as price bends back up
Conclusion
This strategy is a scalping strategy which allows a trader to trade with the long-term trend by using the 132-period EMA.
The SSRC indicator is also effective in determining excellent in determining trade entries and exits. Because of the overextended areas marked by the SSRC indicator, traders could determine if price is at a bargain when trading with the trend. On the other hand, because the SSRC indicator tends to flatten out when price trends, it also allows the trader to hold on to the trade up to near the end of the short-term trend. This allows for a high reward-risk ratio trading strategy due to the entries and exits, while retaining a high win-loss ratio because of the 132 EMA filter.
Recommended MT4 Broker
- Free $50 To Start Trading Instantly! (Withdrawable Profit)
- Deposit Bonus up to $5,000
- Unlimited Loyalty Program
- Award Winning Forex Broker
- Additional Exclusive Bonuses Throughout The Year

>> Claim Your $50 Bonus Here <<
Click here below to download: