


Overbought-Oversold Confluence Forex Trading Strategy
Indicators, price action, candlestick patterns, to some extent these individual trading technical tools work. Some better than the other. Some are not so good, backtested it would yield a negative return. Those that are really good individually, would yield a positive return but it won’t be stellar. However, if you’d bring them all together, it could be something that could be really good.
Think of your trading strategy as a recipe. All of these components, indicators, patterns, etc., these are ingredients to your masterpiece. Each one brings a different flavor and characteristic to what you are making. And as you add each component together, the result becomes something far greater than each individual component. That is how you build a strategy.
However, when building a strategy, each component must complement each other for better results. Components of trading strategies should either filter out and agree with each other. Having these different components agree is called confluence. This is when several components, indicators, price action, candlestick patterns, etc., agree as to the direction of the trend.
With this strategy, we will be looking to combine a couple of indicators that specialize in identifying overbought and oversold market conditions with candlestick patterns.
The Setup: Bollinger Band, Stochastic, and Candlestick Pattern Confluence
Bollinger Bands is an indicator that draws a mean, represented by a middle line, and its standard deviations represented by the outer bands. This results in an indicator that draws three lines, an upper band, a middle line (mean), and a lower band. Having an upper and lower band, the Bollinger Bands is an excellent tool in identifying overbought and oversold market conditions. Basically, if price is above the upper band, then the market is overbought. If price is below the lower band, then the market is oversold. Being able to identify overbought and oversold market conditions is a gem if used in a market reversal trading strategy. However, the Bollinger Band has a weakness. Although it does identify if the market is ready to reverse, it doesn’t identify when exactly the market is starting to reverse.
To identify the actual reversals, we will be using the Stochastic indicator. The stochastic indicator is also an excellent tool to use when identifying overbought and oversold conditions. Basically, what you have is an oscillating indicator with two lines crisscrossing each other. It also has horizontal lines on the 80 and 20 mark to identify overbought and oversold conditions. If the lines are above the 80 then the market is said to be overbought. If the lines are below 20 then the market is said to be oversold. Its advantage though is that the stochastics itself could generate a buy or sell signal. A buy signal is generated as the faster line crosses above the slower line, while a sell signal is generated as the faster line crosses below the slower line. Signals could occur anywhere on the stochastic indicator, but for higher probability setups, a crossover on the overbought or oversold areas usually yield better results. This means that both lines should be above 80 or below 20.
To cap off our reversal signals, we will make use of reversal candlestick patterns. These are identifiable patterns that have been statistically proven to signify reversals. We will be using two of the most popular patterns, the pinbar and the engulfing pattern. The pinbar is a candlestick pattern with a long wick either above or below a small body. An engulfing pattern on the other hand is a full bodied, long candle, that is bigger than the preceding candle. Since these two are very popular and are easily identifiable, more traders are looking at it and would most likely be trading the same direction as this strategy’s trade direction.
All of these should be in confluence. Price should have been going over the outer Bollinger Bands, the Stochastic indicator should have a crossover either on an overbought or oversold area, and the crossover candle should also be a reversal candlestick pattern.
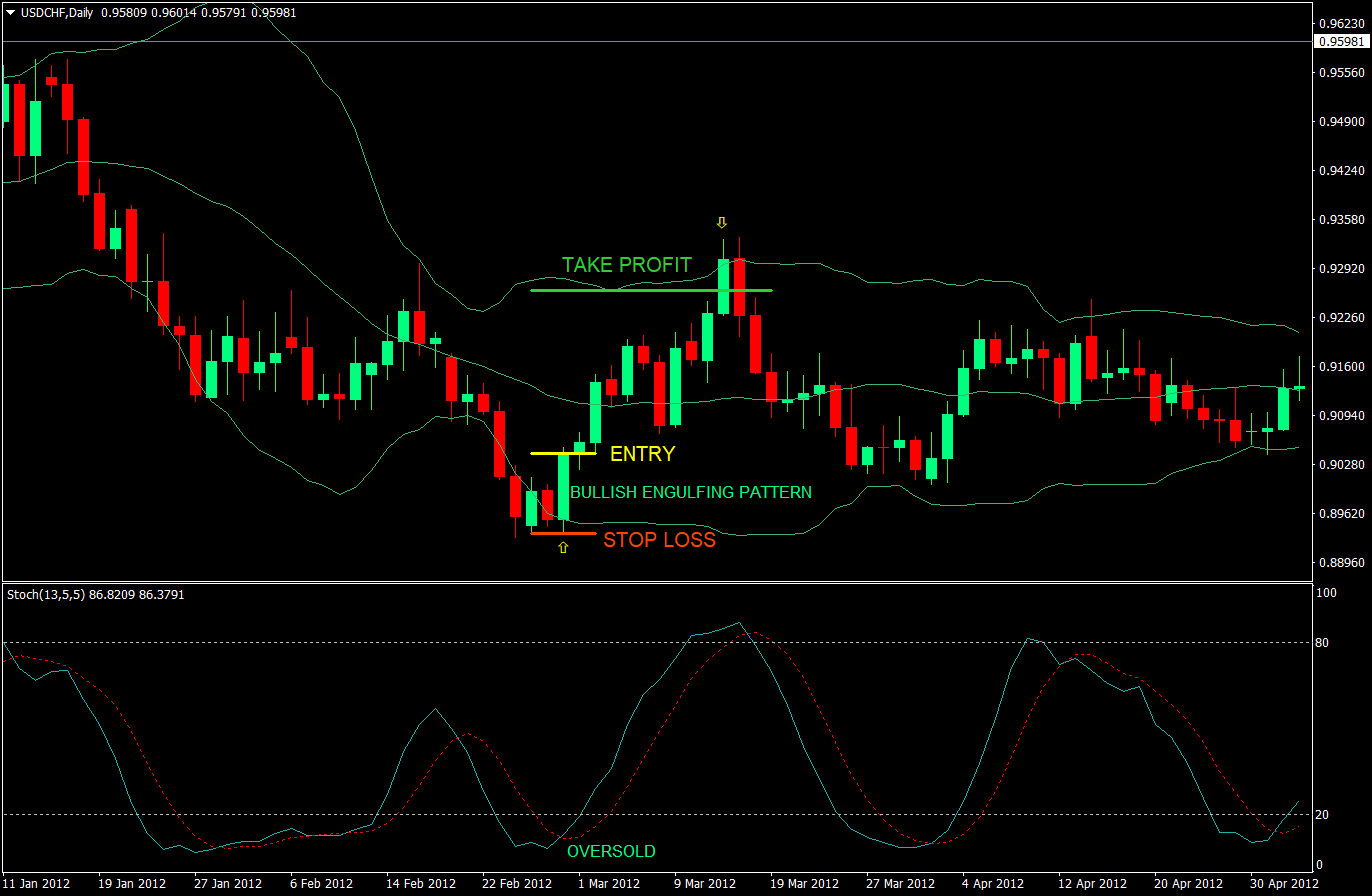
Buy Entry:
- Price should be below or should have come from below the lower Bollinger band
- The faster Stochastic line should cross above the slower Stochastic line
- Both Stochastic line should be below 20 indicating an oversold market condition
- A reversal candlestick pattern should be identified
- Enter at the close of the candle
Stop Loss: Set the stop loss at the low of the entry candle
Take Profit: Set the take profit 2x the stop loss distance
Sell Entry:
- Price should be above or should have come from above the upper Bollinger band
- The faster Stochastic line should cross below the slower Stochastic line
- Both Stochastic line should be above 80 indicating an overbought market condition
- A reversal candlestick pattern should be identified
- Enter at the close of the candle
Stop Loss: Set the stop loss at the high of the entry candle
Take Profit: Set the take profit 2x the stop loss distance
Conclusion
This strategy is all about confluence of reversal indications. Having all three, Bollinger Bands, Stochastics, and candlestick patterns, pointing towards the same direction significantly increases the probability that a reversal may occur. Plus, factoring in the overbought and oversold conditions of both the Bollinger Bands and the Stochastics, a reversal will more likely occur.
However, many traders may easily get frustrated or impatient waiting for all three to line-up. Some may take trades even though all the rules have not yet been met.
Another error that traders could make is taking a trade even though a crossover of both lines occurred on areas not exactly on overbought or oversold areas. Take note that both lines should either be above 80 or below 20.
Although it was only the pinbar and the engulfing pattern that were used in this strategy, other reversal candlestick patterns could also work. But these two have higher probabilities because many traders easily identify them. Having some additional knowledge of reversal patterns would certainly be beneficial.
Recommended MT4 Broker
- Free $50 To Start Trading Instantly! (Withdrawable Profit)
- Deposit Bonus up to $5,000
- Unlimited Loyalty Program
- Award Winning Forex Broker
- Additional Exclusive Bonuses Throughout The Year

>> Claim Your $50 Bonus Here <<
Click here below to download: