


MACD Hidden Divergence Forex Trading Strategy
One of the least discussed techniques in trading are the divergences. It might be that it seems not as sexy as other techniques like advanced patterns or price action, etc. But it is something that might be very useful in a trader’s arsenal of techniques.
So, what are divergences? Divergences are basically discrepancies between an oscillating indicator and the price action itself.
What do I mean by this? If you are to look carefully at price action in a chart, you would notice that price bobs up and down forming peaks and valleys. These are the expansions and contractions, or thrusts and retracements.
To a seasoned naked chart trader, trading based on price action alone might already be profitable. However, many other traders also prefer a secondary confirmation for their setups, so they use indicators. Some on chart indicators, while others are oscillating indicators on a different window on their platform, usually at the bottom of their main charts.
Oscillating indicators are mostly used to determine overbought and oversold market conditions, indicators such as the Relative Strength Indicator (RSI), Stochastics, etc. However, oscillating indicators could also be used for identifying possible reversals, without considering overbought and oversold conditions. This is because as price bobs up and down, not only does the price chart form peak and valleys, oscillating indicators also form peaks and valleys corresponding to the price chart movements.
If you’d look closely at the chart below, you would notice how the oscillating indicator bobs up and down corresponding to price movements.
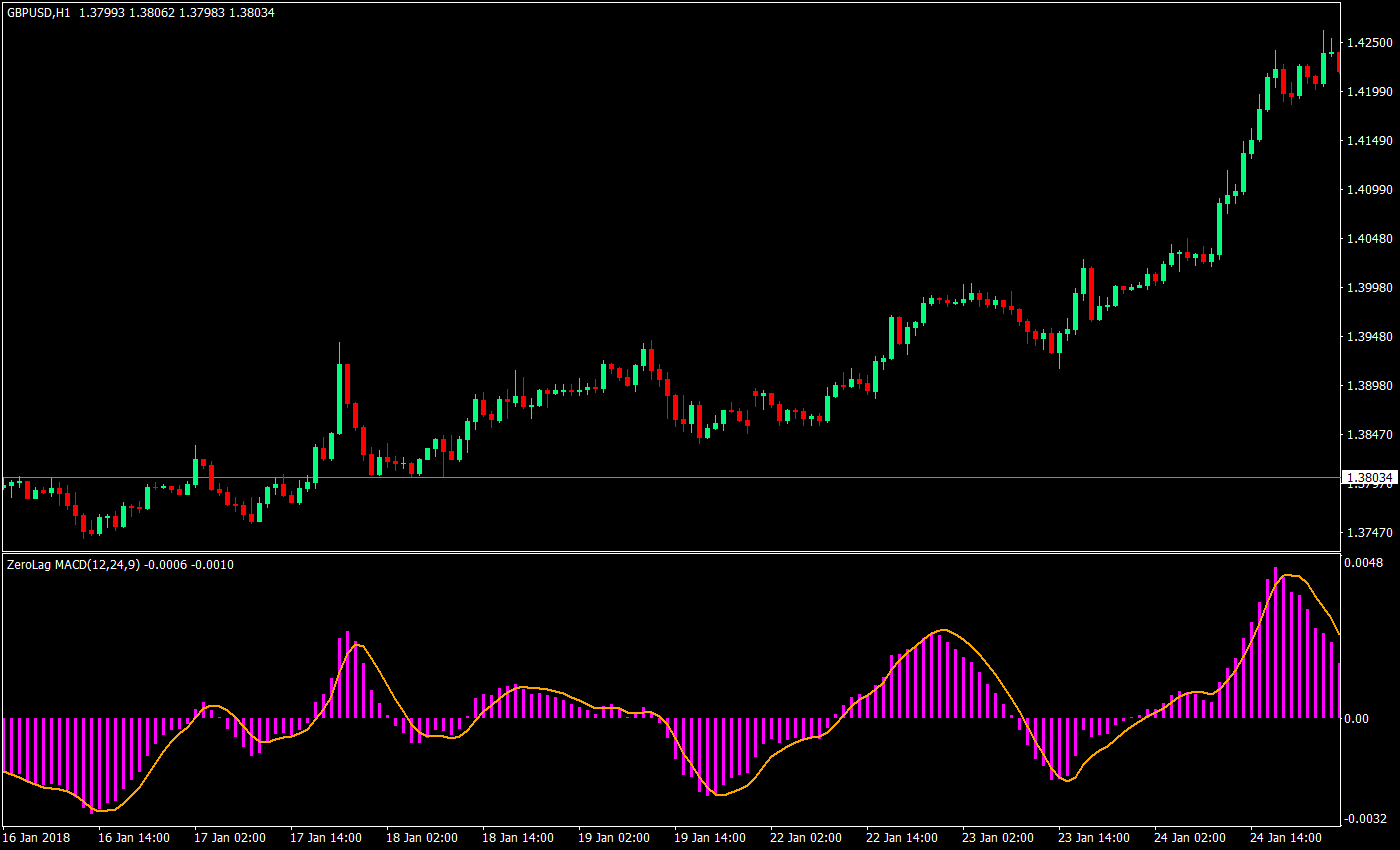
However, if you’d also look closely, you would also notice instances wherein the peaks and valleys height and depth would differ from that of the price chart. These are what we call divergences. It is basically a discrepancy in the height or depth of the price chart’s and oscillating indicator’s peaks and valleys.
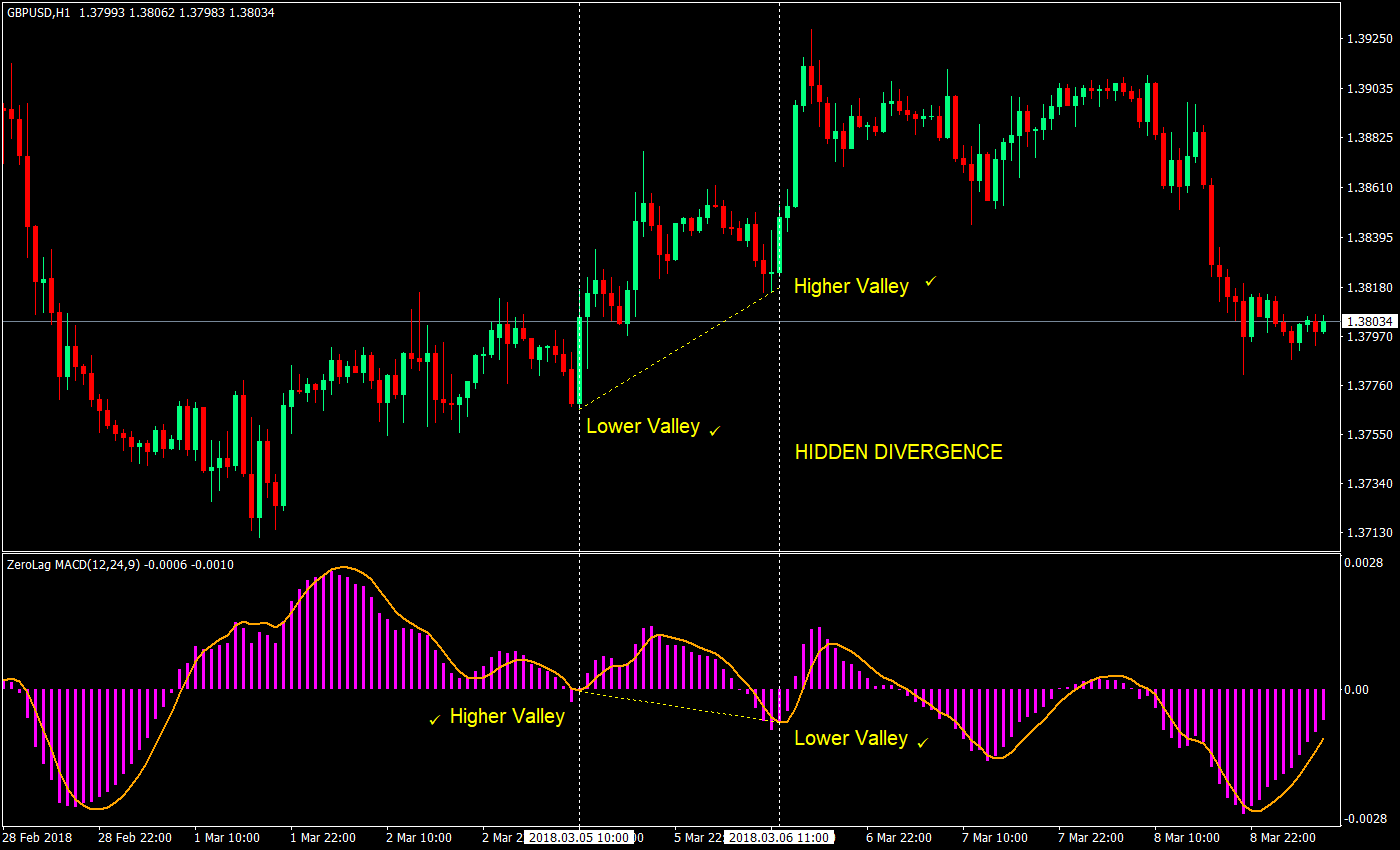
So, what now if they diverge? What this is telling me is that even though the price chart has already formed a low that might not be that deep, mathematically, the oscillating indicators are showing that the retracement is already deep enough. This indicates that price is ready for a sharp reversal. This type of divergence is called a hidden divergence, which usually signifies a reversal of a short retracement.
The use of oscillating indicators is usually related mean reversion strategies, however, with the use of hidden divergences we are effectively trading with the trend. This is because hidden divergences usually correspond with short term retracements.
For this particular strategy, we will be using the Moving Average Convergence Divergence (MACD). This oscillating indicator is derived from a set of moving averages – a fast, slow, and signal moving average. The advantage of using the MACD is that it has a histogram that weaves across the signal line. These crosses could be used as our entry signal.
Let’s test how effective the MACD is for use with hidden divergences.
The Setup: MACD Hidden Divergence Setup
Buy Entry:
- Identify potential valleys on the MACD indicator.
- Identify the corresponding valleys on the price chart.
- Try to assess if the next valley on the MACD indicator would be lower than the previous valley.
- Try to assess if the next valley on the price chart would be higher than the previous valley.
- If so, a hidden bullish divergence might be formed.
- Enter a buy market order on the candle close corresponding to the histogram that closes above the signal line.
Stop Loss: A few pips below the fractal formed by the up thrust.
Exit: Close the trade on the candle corresponding the first histogram to close above the zero line.
Sell Entry:
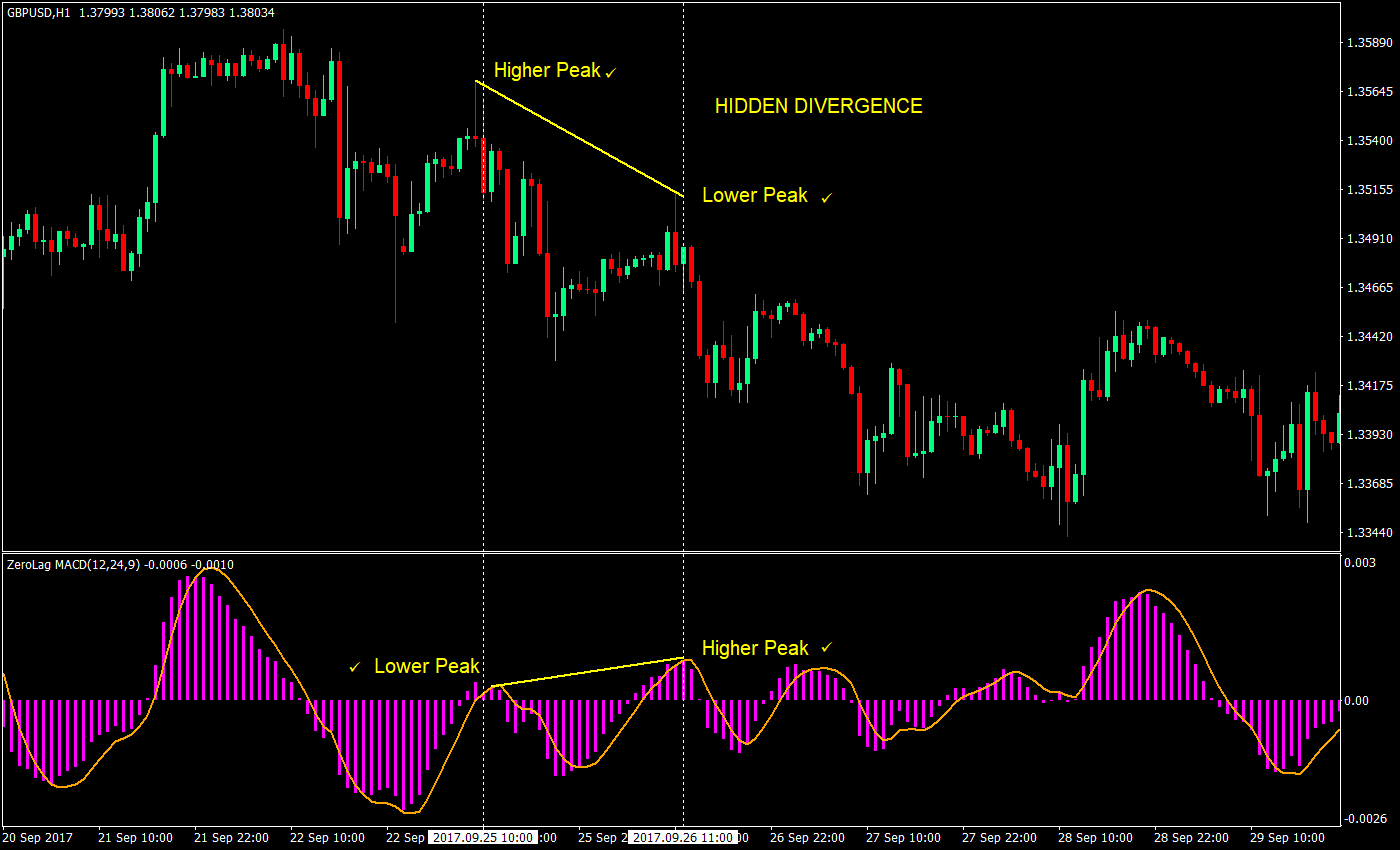
- Identify potential peaks on the MACD indicator.
- Identify the corresponding peaks on the price chart.
- Try to assess if the next peak on the MACD indicator would be higher than the previous peak.
- Try to assess if the next peak on the price chart would be lower than the previous peak.
- If so, a hidden bearish divergence might be formed.
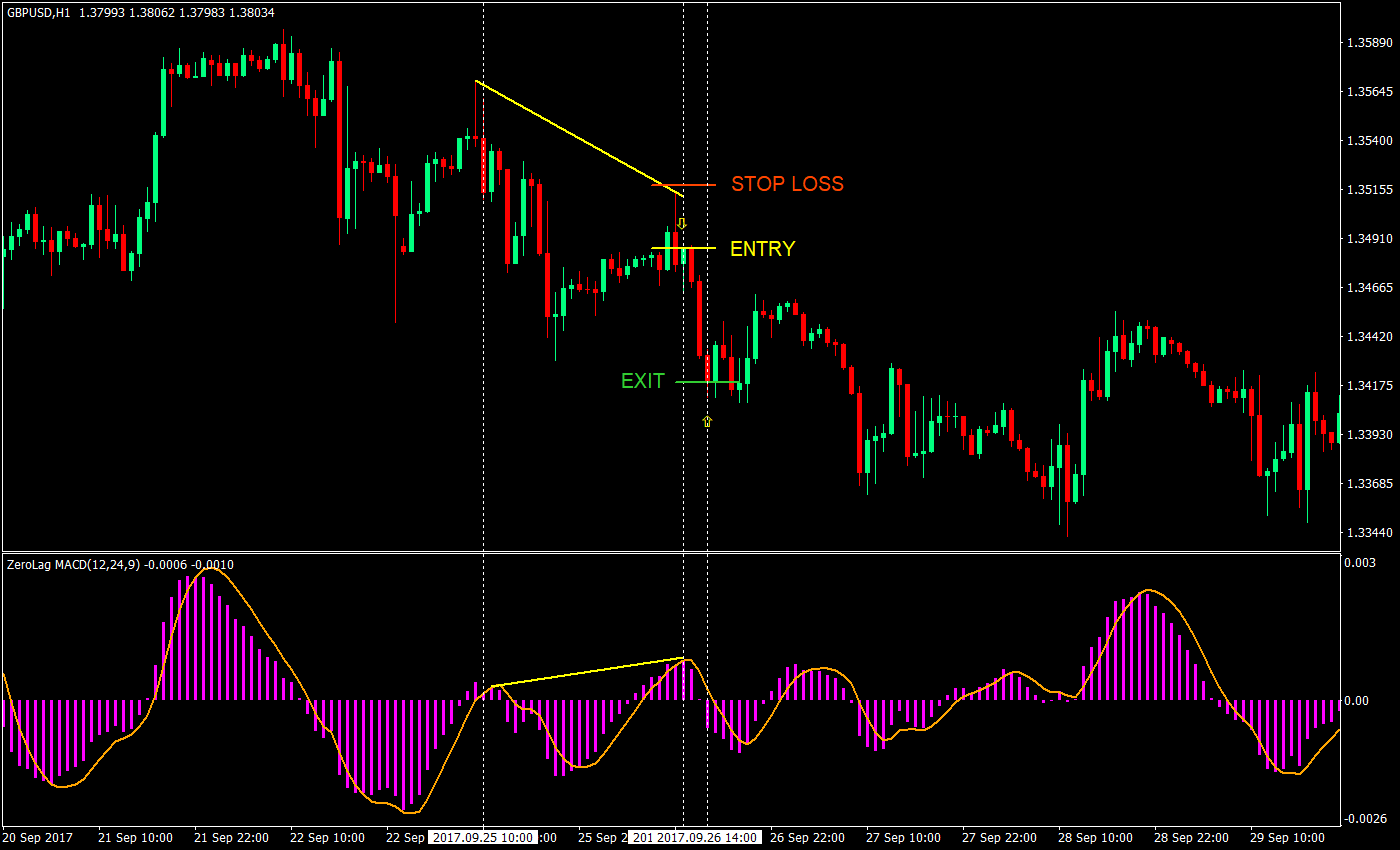
- Enter a sell market order on the candle close corresponding to the histogram that closes below the signal line.
Stop Loss: A few pips above the fractal formed by the down thrust.
Exit: Close the trade on the candle corresponding the first histogram to close below the zero line.
Conclusion
Divergences, although not perfect, are very powerful techniques to use. For one, an oscillating indicator is a powerful tool to use for mean reversion setups. However, combined with hidden divergences, it becomes even more powerful. Since hidden divergences usually occur on minor retracements, the probability of a successful trade is higher, since chances are you are still trading with the trend, not against it.
However, though divergences are probable indicators of reversals, there are still some signals that fail to succeed. One reason could be that the histogram crosses just for one candle and returns back to the other side of the signal line. This often results to a setup that doesn’t correspond to the actual peak or valley of the oscillating indicator. We cannot eliminate these occurrences completely. What we can do however is to minimize it by avoiding trading prior to the actual close of the candle. There will be times when in the middle of a candle, the histogram would cross the signal line, but just before the candle closes, the histogram reprints. This is because most indicators are computed real time on tick, instead of per bar. This is the reason why our rules specifically state that we enter the trade on the close of the candle.
Another reason could be that even if the histogram crosses the signal line, the trajectory of the MACD signal line might still be pointed towards the direction it was going. This signifies either that price might still continue further before turning, or that the MACD histogram would soon cross the signal line before crossing the zero line.
There are many possible reasons why a trade could fail. Ultimately, price is king. The MACD oscillating indicator follows price movement, not the other way around.
Also, if you’d try to observe the charts, you would notice that there would really be some failed trades. There is no other way to go around this but to have a sound conservative money management strategy to go along with your strategy.
Recommended MT4 Broker
- Free $50 To Start Trading Instantly! (Withdrawable Profit)
- Deposit Bonus up to $5,000
- Unlimited Loyalty Program
- Award Winning Forex Broker
- Additional Exclusive Bonuses Throughout The Year

>> Claim Your $50 Bonus Here <<
Click here below to download: