


Long-term trend crossovers are an interesting scenario to watch, even on the lower timeframes. Whenever price goes near the area of a long-term moving average line, price movements become interesting.
At times, price would bounce off completely from the area of a long-term trend. This is when traders consider price to be at a discount on a trending market, knowing that price has moved to the average price range.
On some occasions, price movement would become choppy and volume runs dry. In this scenario, most traders are staying on the sidelines and are avoiding to trade knowing that price could move erratically anytime price is near a long-term moving average line. This causes volume to drop and thus causes any minute price movements to be exaggerated on the price chart causing the choppy market environment.
Sometimes price just steam rolls over a long-term moving average line indicating a trend reversal. This is when the market is starting to reverse backed by a strong momentum behind the reversal. This is the scenario where trend reversal traders make money.
But how do we identify if a long-term trend reversal is taking place instead of price bouncing off or becoming choppy? It is in identifying momentum and a confluence of conditions indicating a probable trend reversal.
Fratelli MACD Momentum Cross Forex Day Trading Strategy is a long-term trend reversal strategy based on momentum. It provides trade signals on long-term trend reversals based on momentum using highly reliable momentum indicators.
Fratelli MACD Indicator
The Fratelli MACD indicator is a custom oscillating indicator which is based on the widely used Moving Average Convergence and Divergence (MACD).
This indicator oscillates on a free range with a midpoint at zero. Fratelli MACD oscillates from negative to positive and vice versa depending on the direction of the trend. These indications are then displayed as dots. Positive dots are colored lime and indicates a bullish trend. Negative dots on the other hand are colored magenta and indicates a bearish trend.
Trend signals are generated whenever the dots change colors, indicating a trend reversal. This indicator could also be used as trend direction indicator to help traders filter out trades that go against the current trend direction.
Momentum Indicator
Momentum indicator is exactly what it is called. It is a momentum indicator which is based on price movements using the difference between the close of the current candle and a candle set at a certain distance from the current candle.
This type of computation makes the Momentum indicator a leading indicator. Although theoretically no indicator is actually leading price movements, this indicator tends to have the least lag compared to most trend following and momentum indicators.
This indicator is displayed as an oscillating indicator with a line that moves around zero. Positive Momentum lines indicate a bullish momentum while negative momentum lines indicate a bearish momentum. Crossovers from negative to positive or vice versa could also be used as a momentum reversal signal.
Trading Strategy
This momentum reversal strategy is based on the crossing over of price over the 100-period Exponential Moving Average (EMA) line.
The 100 EMA line represents the long-term trend. Price crossing over it with momentum tends to travel a bit further since it indicates an actual trend reversal. However, not all crossovers of price and the 100 EMA would result in a profit.
To filter out low probability trades, we will be using the Fratelli MACD indicator and the Momentum indicator. The crossover of price and the 100 EMA should be closely aligned with the crossover of the Fratelli MACD dots and the Momentum line from negative to positive or vice versa.
Aside from the conditions above, trade entry candles or a prior candle should be characterized by big full-bodied candles and small wicks. This indicates that the entry candle or an adjacent candle has momentum.
Indicators:
- 100 EMA
- Fratelli_MACD
- Momentum
- Period: 28
Preferred Timeframe: 5-minute and 15-minute charts
Currency Pairs: major pairs only
Trading Session: London and New York sessions
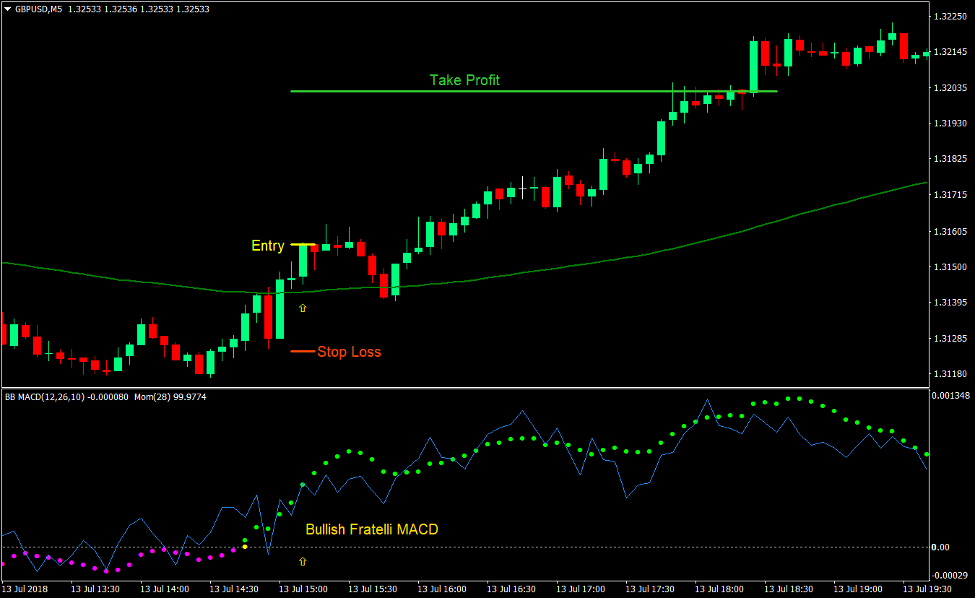
Buy Trade Setup
Entry
- Price should cross above the 100 EMA line.
- A bullish momentum candle should be observable on the chart.
- The Fratelli MACD dots should cross above zero and should be lime indicating a bullish trend reversal.
- The Momentum line should cross above zero indicating a bullish trend reversal.
- These bullish signals should be closely aligned.
- Enter a buy order on the confirmation of the conditions above.
Stop Loss
- Set the stop loss on the fractal below the entry candle.
Take Profit
- Set the take profit target at 1.5x the risk on the stop loss.
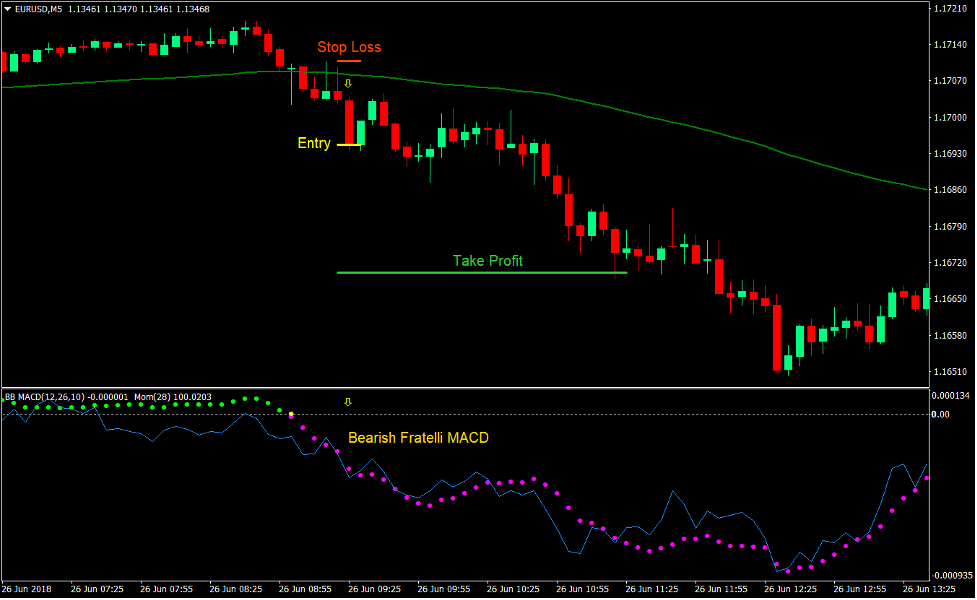
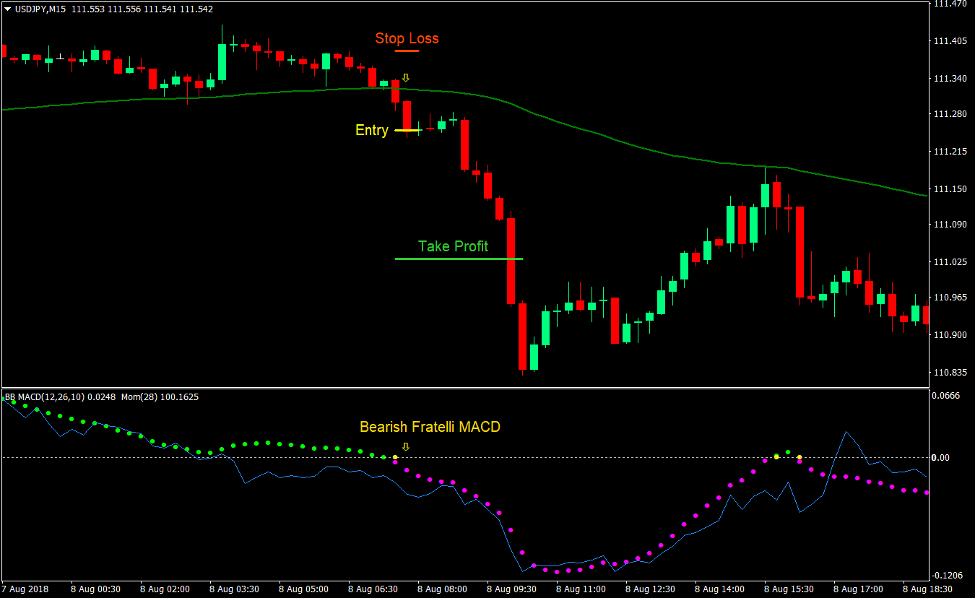
Sell Trade Setup
Entry
- Price should cross below the 100 EMA line.
- A bearish momentum candle should be observable on the chart.
- The Fratelli MACD dots should cross below zero and should be magenta indicating a bearish trend reversal.
- The Momentum line should cross below zero indicating a bearish trend reversal.
- These bearish signals should be closely aligned.
- Enter a sell order on the confirmation of the conditions above.
Stop Loss
- Set the stop loss on the fractal above the entry candle.
Take Profit
- Set the take profit target at 1.5x the risk on the stop loss.
Conclusion
This trading strategy is a good momentum-based trading strategy.
Taking trade signals on momentum crosses over the 100 EMA often results in price moving in the direction of the momentum candle. This is more pronounced on the lower timeframes because most momentum candles on these timeframes are a result of trade transactions done by big institutional traders. Taking trades in the same direction as the big guys is often a good idea.
However, not all crossovers do produce good results. Some end up being reversed by the market right away. This strategy lessens those occurrences by using a confluence of a crossover of price and the 100 EMA, a momentum candle, and a couple of momentum based custom indicators. This greatly improves the expectancy of this momentum-based trading strategy.
Recommended MT4 Brokers
XM Broker
- Free $50 To Start Trading Instantly! (Withdraw-able Profit)
- Deposit Bonus up to $5,000
- Unlimited Loyalty Program
- Award Winning Forex Broker
- Additional Exclusive Bonuses Throughout The Year

>> Sign Up for XM Broker Account here <<
FBS Broker
- Trade 100 Bonus: Free $100 to kickstart your trading journey!
- 100% Deposit Bonus: Double your deposit up to $10,000 and trade with enhanced capital.
- Leverage up to 1:3000: Maximizing potential profits with one of the highest leverage options available.
- ‘Best Customer Service Broker Asia’ Award: Recognized excellence in customer support and service.
- Seasonal Promotions: Enjoy a variety of exclusive bonuses and promotional offers all year round.

>> Sign Up for FBS Broker Account here <<
Click here below to download: