


Professional traders are always out looking for an edge. Anything that would give them even the slightest advantage against the market would be welcome. Any technique or tool that would help them gain higher yields or be more accurate with their strategies would be great.
There are many ways to gain an edge. One of the easiest ways to gain an edge over the market is through technical indicators.
Technical indicators give traders an insight as to what the market might be doing. It could be momentum, volatility, trend or a specific entry signal. These clues and hints when used right could provide excellent trade setups that could produce huge gains.
Below are 5 of the best technical indicators that many professional traders use in order to gain an edge. We have also added strategies that use these indicators as a focal point for a more systematic trading strategy.
#1 – Heiken Ashi Candlesticks Indicator
The first traders who ventured to technical analysis using charts were using bar charts. This is a method of charting prices by marking the open of price on the left side of a vertical bar and the close of price on the right side of the bar. This was the basic way of charting price movements during those days.
Then came the Japanese candlesticks. In this method, price is plotted as candlesticks that change color depending on where price closed in relation to the opening price. This is based on a method dating back to the 18th century used by Japanese rice traders. Now, this has become the standard among many traders.
Japanese traders are quite innovative when it comes to charting price movements. There is now a new type of price charting also developed by the Japanese. Heiken Ashi basically means “average bar” in Japanese. The Heiken Ashi Candlesticks is a method of charting price movements wherein the color of the bar depends on the movement of the average price.
The Heiken Ashi Candlesticks’ open and close price is plotted differently from the traditional candlestick. The “open” is based on the average of the open of the previous bar and the close of the previous bar. The “close on the other hand is based on the average of the open, close, low and close.
The Heiken Ashi Candlesticks is an excellent indicator to use as an entry and exit trigger for those trading with the trend. Because of the fast and responsive nature of the Heiken Ashi Candlesticks, it also works best for strong and fast-moving trends.
Heiken Ashi Candlesticks Trading Strategy
The Heiken Ashi Candlesticks indicator is most suitable for short-term trending markets that have a very strong momentum.
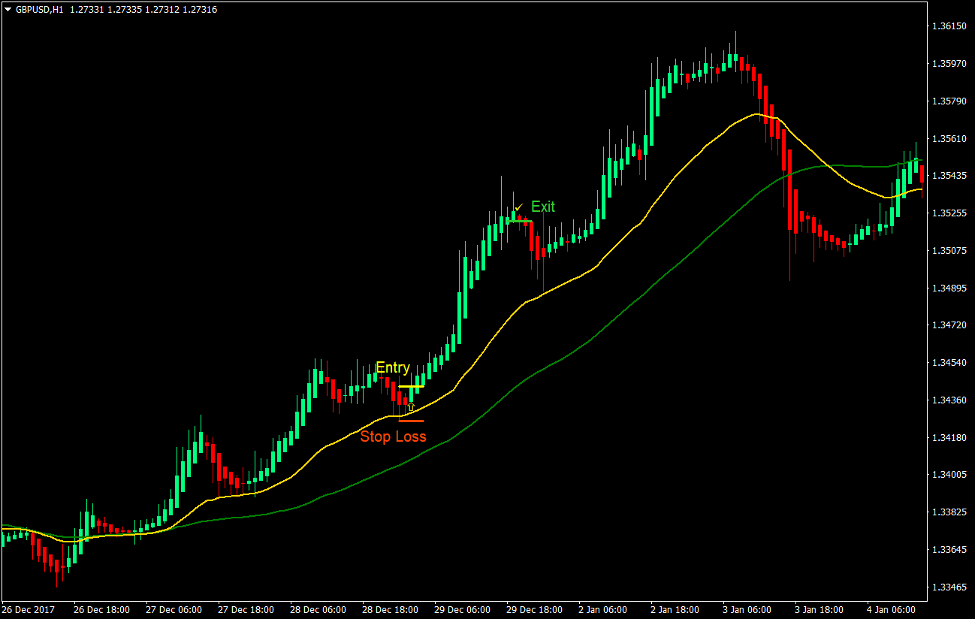
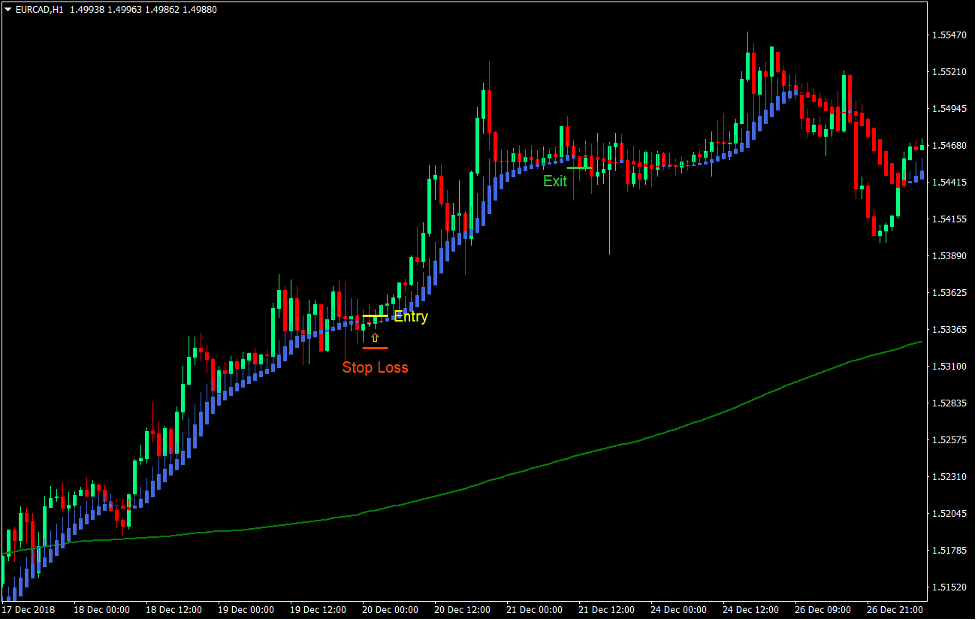
In this strategy we will be identifying the direction of the short-term trend based on the 60-period Simple Moving Average (SMA) and the 30-period Exponential Moving Average (EMA). The trend will be based on how the two moving averages are stacked. The trend is considered bullish if the 30 EMA is above the 60 SMA, and bearish if the 30 EMA is below the 60 SMA. The two moving average lines should also have some separation between them to indicate a strong momentum. Price should also not be entering the area between the two moving average lines and should be rejecting the 30 EMA line every time it is near it.
Trades are then taken whenever the Heiken Ashi Candlesticks’ color changes indicating the direction of the current trend.
Indicators:
- 60 SMA (Green)
- 30 EMA (Gold)
- Heiken Ashi (default setting)
Preferred Time Frames: 1-hour, 4-hour and daily charts
Currency Pairs: major and minor pairs
Trading Session: Tokyo, London and New York sessions
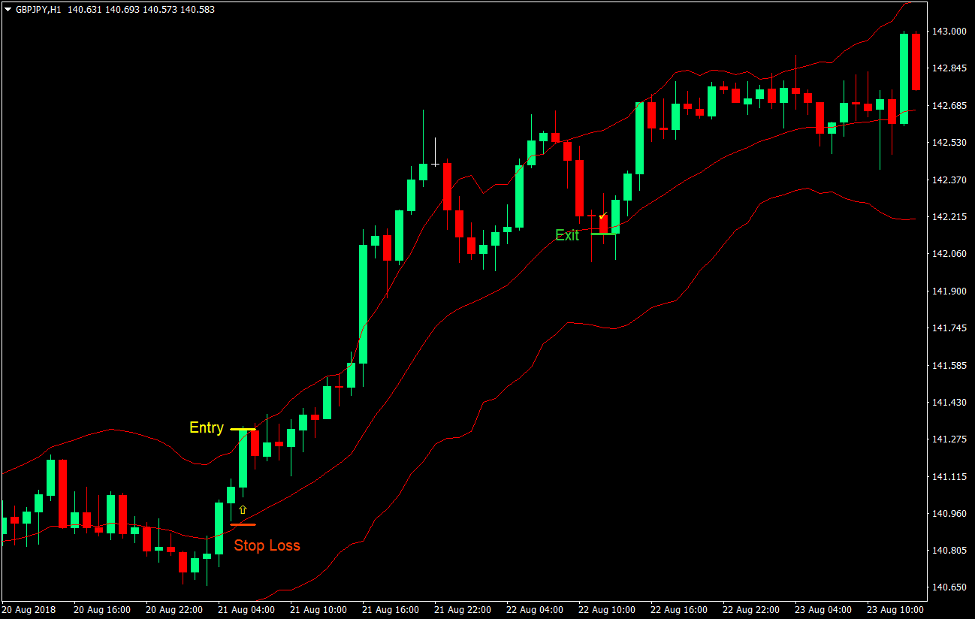
Buy Trade Setup
Entry
- The 30 EMA line should be above the 60 SMA line.
- The moving average lines should be sloping up.
- Price should be above both lines.
- Price should retrace towards the 30 EMA line.
- Enter a buy order as soon as the Heiken Ashi Candlesticks changes to green.
Stop Loss
- Set the stop loss on the fractal below the entry candle.
Exit
- Close the trade as soon as the Heiken Ashi Candlesticks changes to red.
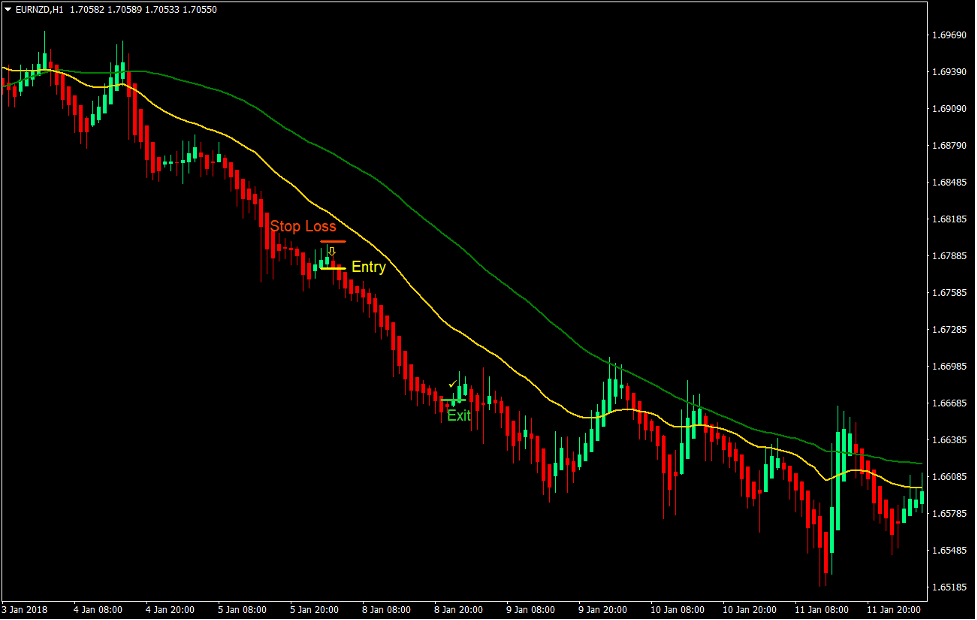
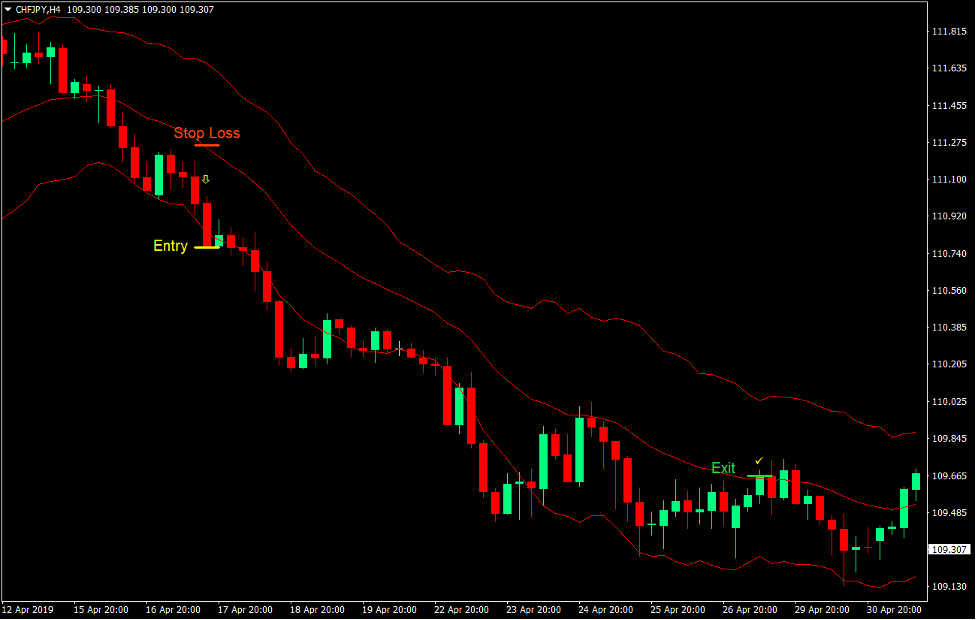
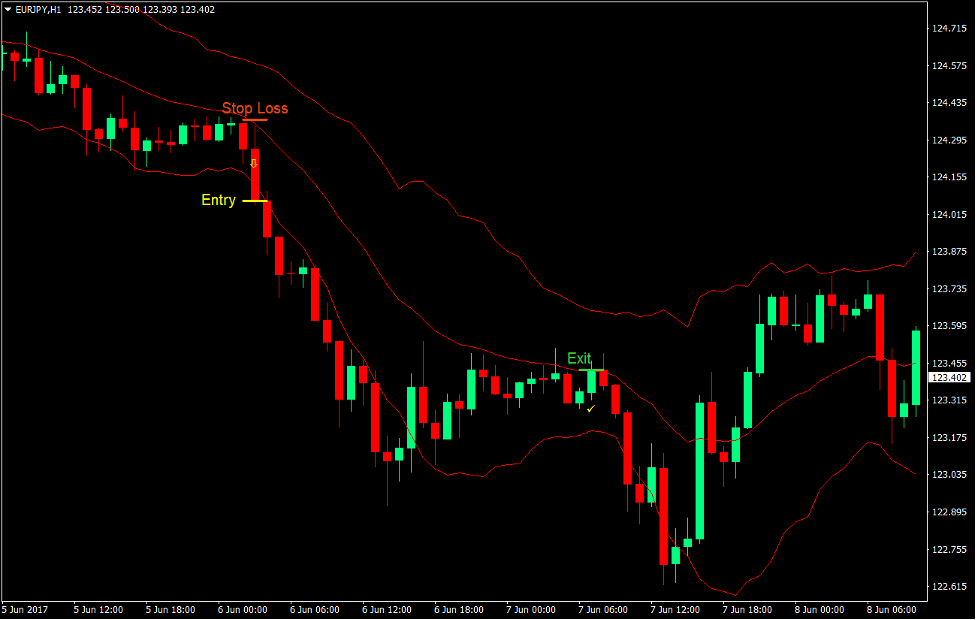
Sell Trade Setup
Entry
- The 30 EMA line should be below the 60 SMA line.
- The moving average lines should be sloping down.
- Price should be below both lines.
- Price should retrace towards the 30 EMA line.
- Enter a sell order as soon as the Heiken Ashi Candlesticks changes to red.
Stop Loss
- Set the stop loss on the fractal above the entry candle.
Exit
- Close the trade as soon as the Heiken Ashi Candlesticks changes to green.
Conclusion on the Heiken Ashi Candlesticks
The Heiken Ashi Candlesticks is one of the best entry and exit triggers for those trading on strong trending markets. It is quick and responsive and is less lagging compared to other technical indicators. This allows traders to capitalize on short-term price movements that could indicate a shift in the short-term trend.
However, this indicator is also quite susceptible to false signals during choppy market conditions. Traders who would want to use this as their main indicator should avoid trading during ranging and choppy markets. It is also best to combine this indicator with a complementary indicator to confirm trend direction and strength.
The strategy above just shows how the indicator could work well during such strong trending markets. It allows traders to capitalize on high yielding trades and allows for some small wins and a few losses every now and then.
#2 – Heiken Ashi Smoothed Indicator
The Heiken Ashi Smoothed indicator is a variation of the Heiken Ashi Candlesticks. However, although they carry the same name, they are very different from each other.
The Heiken Ashi Smoothed indicator is a trend following indicator which is based on the Exponential Moving Average (EMA). Like the EMA, the Heiken Ashi Smoothed indicator computes for the average of price. However, unlike regular moving averages, the Heiken Ashi Smoothed indicator computes four different moving averages. These moving averages are computed based on combinations of the mean of the candles, the average of the open, high, low and close, the highest high of a period, and the lowest low of a period. These computations are then plotted as candlesticks along with the price candles.
If you would observe a chart with a Heiken Ashi Smoothed indicator, you would notice the Heiken Ashi Smoothed candles being plotted close to price action, but not completely overlapping it, unlike the standard Heiken Ashi Candlesticks. These candles move smoothly on the price chart, changing colors only when the trend has changed. The body and the wicks grow larger as momentum increases, and contracts as momentum weakens. These characteristics make the Heiken Ashi Smoothed indicator very reliable.
The Heiken Ashi Smoothed indicator is a very reliable indicator when used on the right time frame. It usually reverses only when the market has already confirmed to have reversed and stays with the trend as long as possible.
Traders would also have an early indication of a probable reversal and could exit trades earlier once they see the Heiken Ashi Smoothed candles contract, which could also be confirmed by reversal or price rejection candlestick patterns.
Heiken Ashi Smoothed Strategy
This strategy is an example of how the Heiken Ashi Smoothed indicator could work well as the main entry and exit trigger indicator.
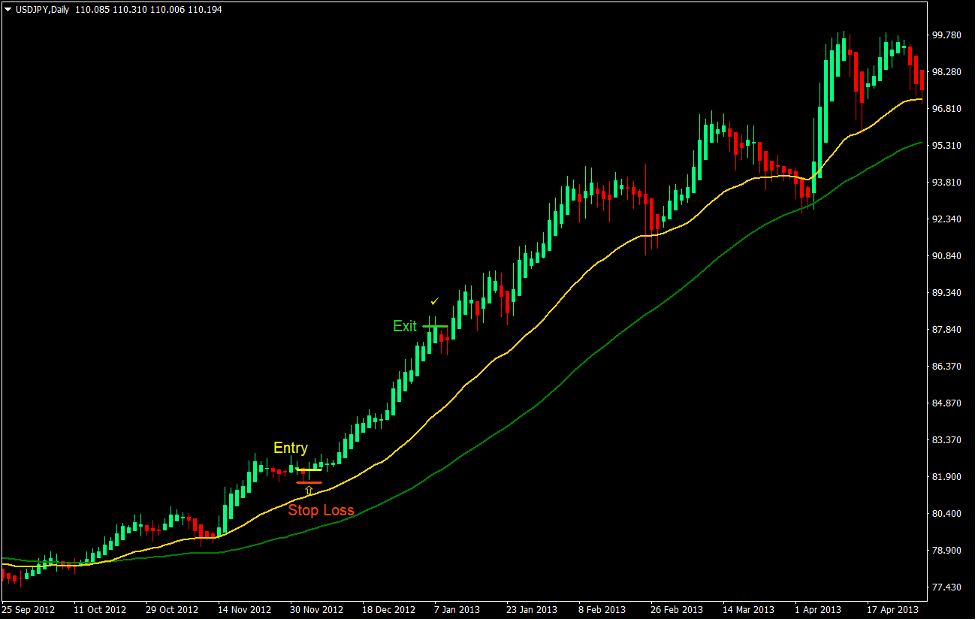
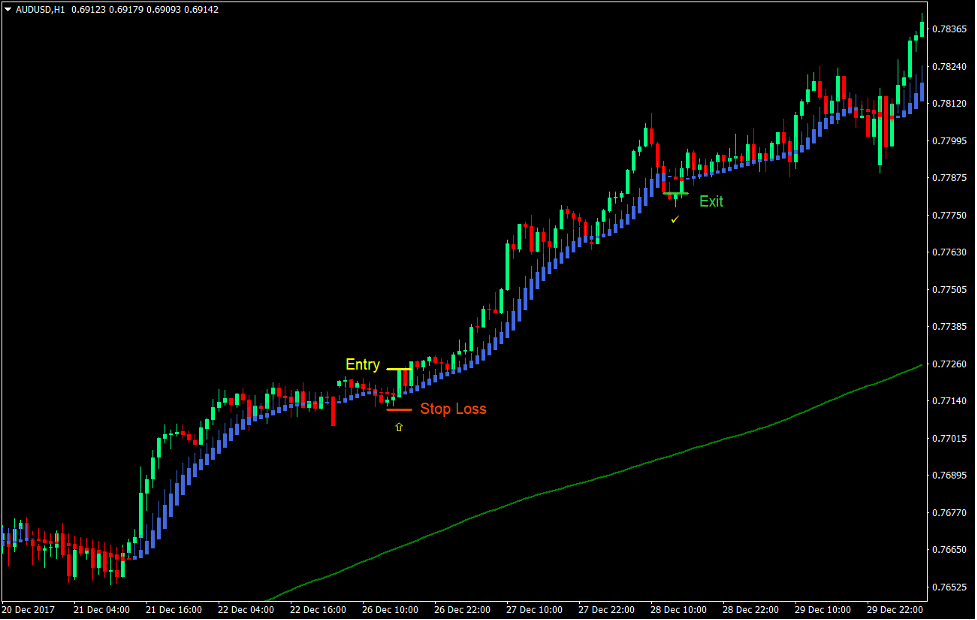
The Heiken Ashi Smoothed indicator works best on mid-term trends. As such, it is best to align the trade direction with the long-term trend. For this reason, we will be using the 200-period Simple Moving Average (SMA).
The trend would be based on how the 200 SMA line is sloping. If it is sloping up, then only buy trade signals will be considered. It if is sloping down, then only sell trade signals will be considered. This should also be confirmed by the location of price in relation to the 200 SMA line. Price action should also be trending based on a visual observation of how price is moving.
Trades are taken as soon as the Heiken Ashi Smoothed candles change color pointing the direction of the current trend. This usually occurs after a retracement or a contraction phase.
The candle coinciding with the changing of the Heiken Ashi Smoothed candle color should also close in the direction of the trend. This would help us avoid spinning tops and indecision candles which are common during market contraction phases.
Indicators:
- 200 SMA (Green)
- Heiken_Ashi_Smoothed (default setting)
Preferred Time Frames: 1-hour, 4-hour and daily charts
Currency Pairs: major and minor pairs
Trading Sessions: Tokyo, London and New York sessions
Buy Trade Setup
Entry
- Price should be above the 200 SMA line.
- The 200 SMA line should be sloping up.
- The market should contract allowing the Heiken Ashi Smoothed candles to temporarily change to red.
- Enter a buy order as soon as a Heiken Ashi Smoothed candle changes to blue coinciding with a bullish candlestick.
Stop Loss
- Set the stop loss on the fractal below the entry candle.
Exit
- Close the trade as soon as the Heiken Ashi Smoothed candles changes to red.
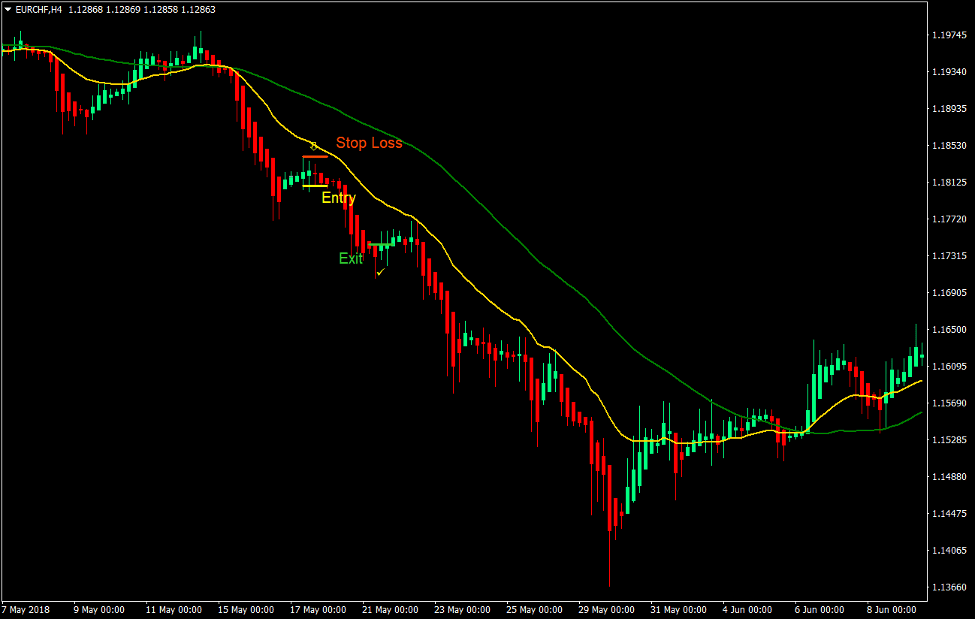
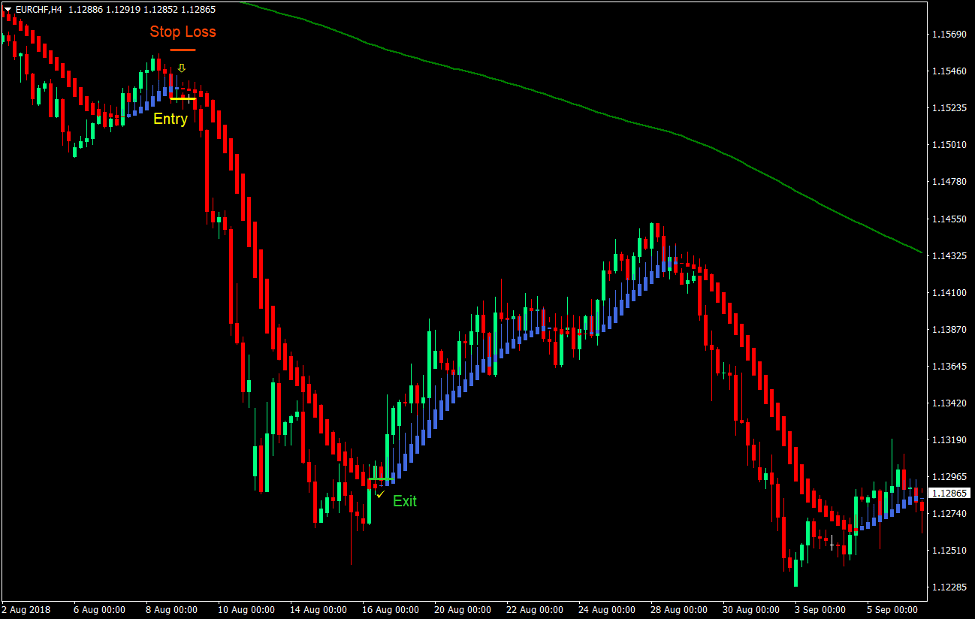
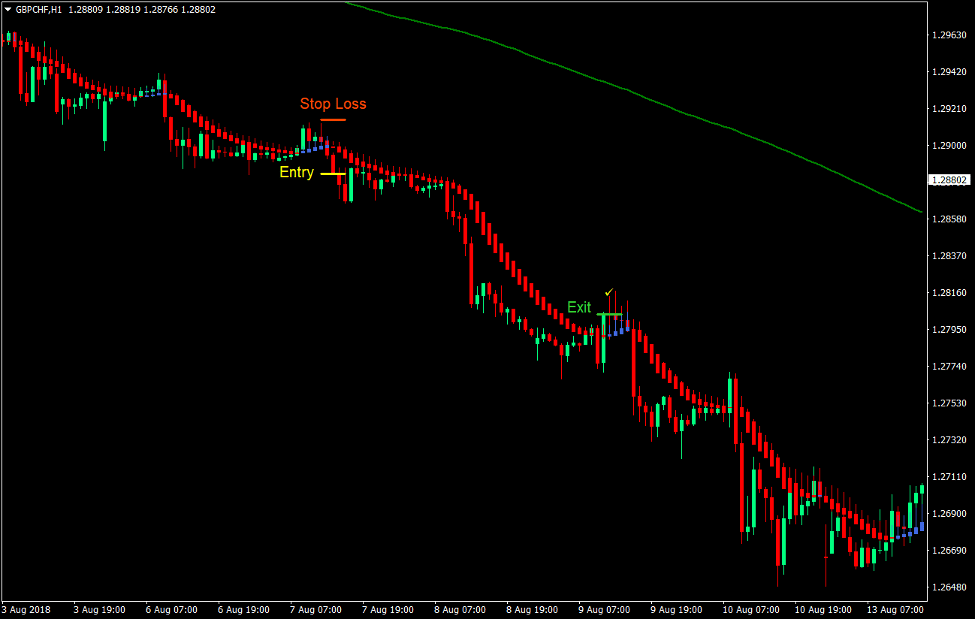
Sell Trade Setup
Entry
- Price should be below the 200 SMA line.
- The 200 SMA line should be sloping down.
- The market should contract allowing the Heiken Ashi Smoothed candles to temporarily change to blue.
- Enter a sell order as soon as a Heiken Ashi Smoothed candle changes to red coinciding with a bearish candlestick.
Stop Loss
- Set the stop loss on the fractal above the entry candle.
Exit
- Close the trade as soon as the Heiken Ashi Smoothed candles changes to blue.
Conclusion on the Heiken Ashi Smoothed Indicator
The Heiken Ashi Smoothed indicator is a reliable mid-term trend following indicator. In fact, it is probably one of the best mid-term trend following indicators.
The sample trading strategy above just shows how well the Heiken Ashi Smoothed indicator works. It is not perfect, but when used in the right market condition, it could do wonders. The sample strategy is a high yield type of strategy, which allows traders to profit because of the huge gains that traders could accumulate on the winning trades.
There are other ways to trade the Heiken Ashi Smoothed indicator. Traders could trade reversals from key support or resistance areas. They could also use it in tandem with another indicator to identify high probability trade entries.
The key to using the Heiken Ashi Smoothed indicator is by using it in the right market condition, which is in line with the long-term trend. It does not work well on choppy and ranging markets, however, it works wonders on a market that is trending or has a potential to reverse from a key area.
#3 – Ichimoku Kinko Hyo Indicator
Few indicators could claim being a complete trading strategy by itself. Most would need another indicator to filter out bad trades, identify trends or provide a specific entry trigger.
The Ichimoku Kinko Hyo indicator, however, is one of those few indicators that could claim being a complete strategy using a standalone indicator. This is because it has all the elements needed for a complete trading strategy. It identifies the long-term trend and the mid-term trend using several modified moving average lines which are very effective and reliable. This allows traders to align the long-term trend with the mid-term trend. Using the same lines to identify the mid-term and short-term trend, the indicator also provides a specific entry signal which traders could use as their basis to enter or exit a trade. Finally, it also has another line which could help traders identify choppy market conditions based on price action, which would nullify trade setups that transpire during a bad market condition.
The Ichimoku Kinko Hyo indicator is composed of five lines, the Kijun Sen (Base Line), Tenkan Sen (Turning Line), Chikou Span (Lagging Line), and the Senkou Span A and Senkou Span B which forms the Kumo (Cloud).
First, the Kijun Sen or the Base Line. It is simply the median of the highest high and the lowest low for the past 26 periods. This line represents the short- to mid-term trend.
The Tenkan Sen or the Turning Line is the line paired with the Kijun Sen. It is the median of the past nine periods and represents the short-term trend.
Trade signals are typically generated whenever the two lines intersect. However, trades are filtered based on the long-term trend and whether the market is choppy or not.
The Chikou Span or the Lagging Line is the line used to identify choppy markets. It is simply the closing price of each candle plotted 26 periods behind the current price action. During choppy markets, this line would typically be moving erratically and would often intersect with the current price action and the other lines.
Senkou Span A is simply the average of the Tenkan Sen and the Kijun Sen plotted 26 periods ahead of the current price action. Senkou Span B on the other hand is computed by averaging the highest high and the lowest low for the past 52 periods and plotted 26 periods ahead of the current price action. The long-term trend is based on how these two lines are stacked. If Senkous Span A is above Senkou Span B, then the market is said to be in an uptrend. If the lines are stacked inversely, then the market is said to be in a downtrend.
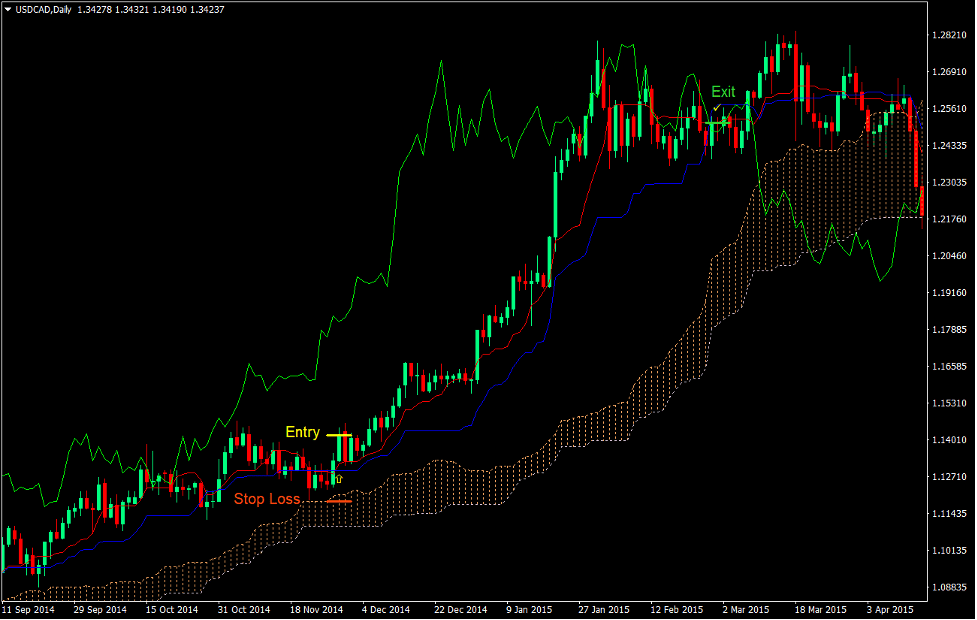
Ichimoku Kinko Hyo Trading Strategy
This trading strategy is one of the ways traders use the Ichimoku Kinko Hyo indicator to identify trade setups. It is mainly centered around aligning the long-term trend direction indicated by the Senkou Span A and B, and the crossover signals of the Kijun Sen and Tenkan Sen line.
Trades will be filtered based on the long-term trend. This will be based on how the Senkou Span A and B (dotted lines) are stacked as discussed above.
During the expansion phase of a trend, the Kijun Sen (blue line) and Tenkan Sen (red line) will be stacked in a way which is in line with the long-term trend. However, during retracements, the two lines will temporarily reverse.
Traders should also check if the Chikou Span (lime line) is crossing over the other lines or is aggressively crossing price action as this indicates a choppy market condition. If so, then trading should be avoided.
Indicators: Ichimoku (default setting)
Preferred Time Frames: 1-hour, 4-hour and daily charts
Currency Pairs: major and minor pairs
Trading Sessions: Tokyo, London and New York sessions
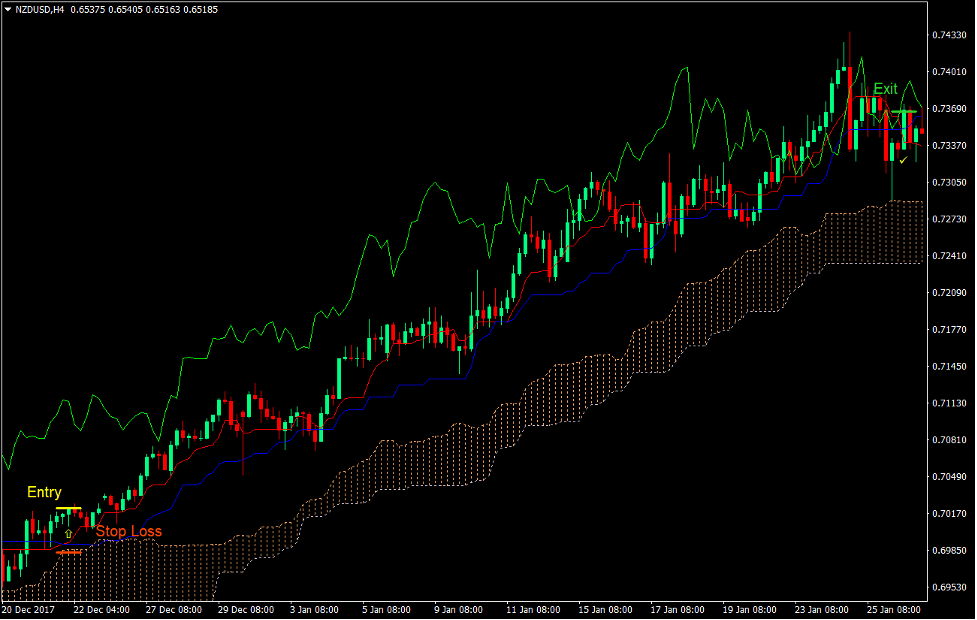
Buy Trade Setup
Entry
- Senkou Span A should be above Senkou Span B.
- Price should retrace causing the Kijun Sen (blue line) and the Tenkan Sen (red line) to temporarily reverse.
- The Tenkan Sen line should cross above the Kijun Sen line.
- The Chikou Span (lime line) should not cross the other lines.
- Enter a buy order on the confirmation of these conditions.
Stop Loss
- Set the stop loss on the fractal below the entry candle.
Exit
- Close the trade as soon as the Tenkan Sen line crosses below the Kijun Sen line.
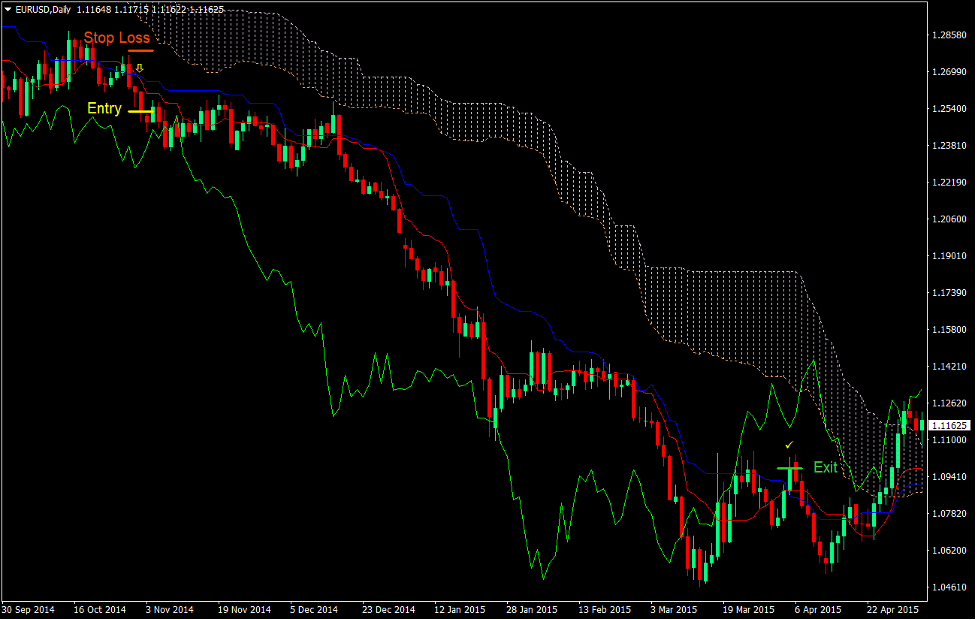
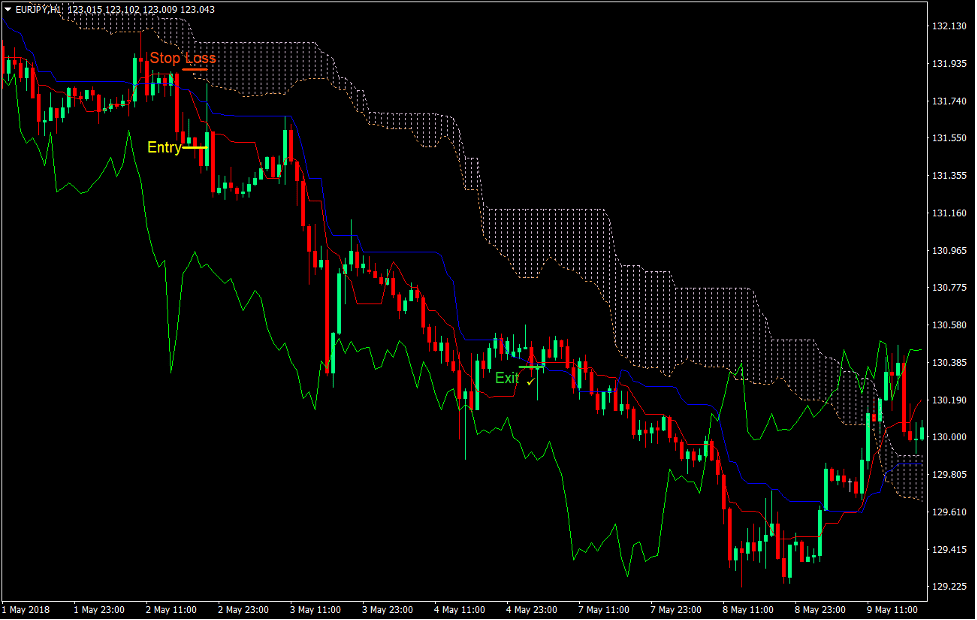
Sell Trade Setup
Entry
- Senkou Span A should be below Senkou Span B.
- Price should retrace causing the Kijun Sen (blue line) and the Tenkan Sen (red line) to temporarily reverse.
- The Tenkan Sen line should cross below the Kijun Sen line.
- The Chikou Span (lime line) should not cross the other lines.
- Enter a sell order on the confirmation of these conditions.
Stop Loss
- Set the stop loss on the fractal above the entry candle.
Exit
- Close the trade as soon as the Tenkan Sen line crosses above the Kijun Sen line.
Conclusion on the Ichimoku Kinko Hyo Indicator
Many new traders avoid the Ichimoku Kinko Hyo indicator when they first see it because of the many lines that are presented to them. It often gives an impression that using this indicator is very difficult and could be very confusing.
Although it could take time for new traders to get used to it, the Ichimoku Kinko Hyo is one of the very few indicators that have been proven to be profitable based on a long-term back test.
Traders who use this indicator as the focal point of their strategy and even those who use it as their only indicator consistently make profits over the long run.
#4 – Pivot Points Indicator
There is a myriad of indicators available to forex traders out there. However, there are only a few which are commonly used by the pros. Pivot Points indicator is one of the very few indicators that the professionals commonly use. It is used by big institutional traders trading for the big banks. If they are using it, then we as retail traders might also benefit from using this indicator.
The Pivot Points indicator is a technical analysis indicator used to identify key areas of interest on the price chart over different timeframes. It is composed of the Pivot Point (PP), which is its midline and main line, Support 1 (S1), Support 2 (S2), Resistance 1 (R1), and Resistance 2 (R2).
The Pivot Point (PP) is basically the average of the high, low and close of the previous period. It could be based on the previous day, week or month.
The following are the various computations for the other lines.
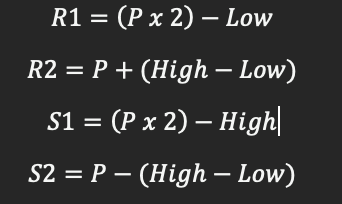
These lines are then plotted on the price chart marking support and resistance areas where price could have some action.
The unique thing about Pivot Points is that many professional traders are looking at the same support or resistance line. In trading, having a bulk of the market looking at the same key area and having the same idea of what price is about to do means a lot. It could mean a strong and reliable trade setup.
If you would observe price charts, you would notice how price would often respect the area around these supports and resistances. Price would usually bounce off it during a market reversal scenario or would get attracted to it during a strong momentum price movement.
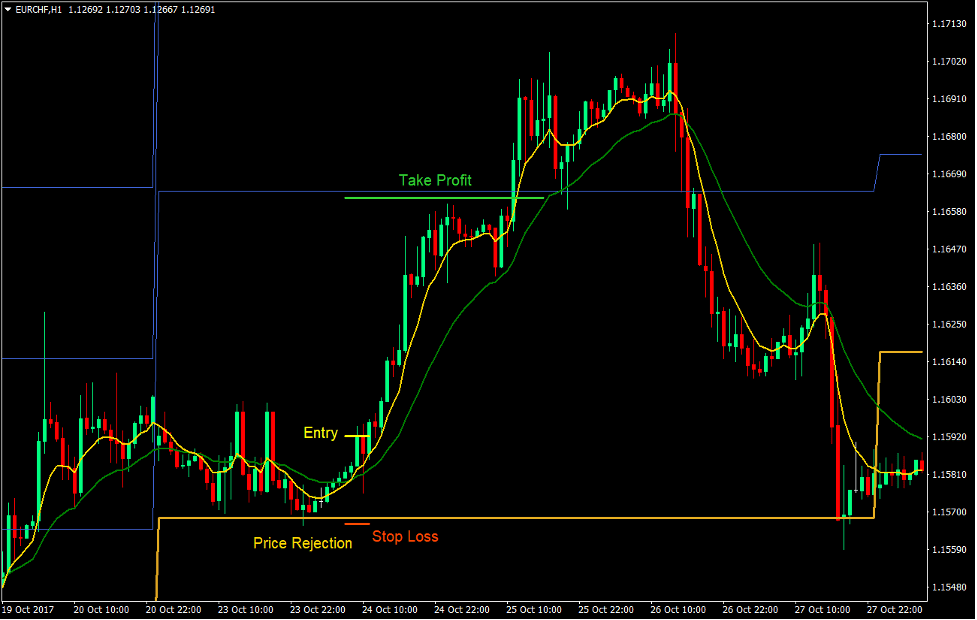
Pivot Points Trading Strategy
This strategy shows how the price would often bounce off the Pivot Point support and resistance lines.
It makes use of two moving average lines to confirm a trend reversal and make entry triggers more objective. We will be using the 7-period Exponential Moving Average (EMA) and a 21-period Exponential Moving Average (EMA) as our crossover entry signal.
However, traders should still observe price action and how price is behaving around the area near the Pivot Points in order to determine what price might do.
Traders should also determine if the reward-risk ratio of the trade is worth taking by determining if the entry is farther from the next Pivot Point line compared to the support or resistance line where it bounced.
Indicators:
- PivotWeekly (default setting)
- 7 EMA (Green)
- 21 EMA (Gold)
Preferred Time Frames: 30-minute and 1-hour charts
Currency Pairs: major and minor pairs
Trading Sessions: Tokyo, London and New York sessions
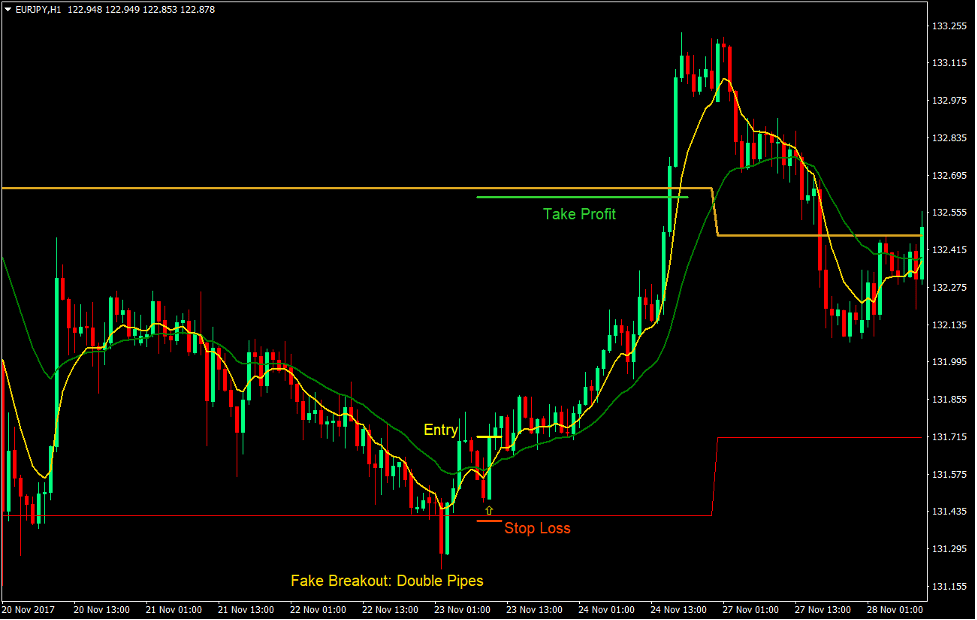
Buy Trade Setup
Entry
- Price should show signs of price rejection from any of the Pivot Point lines, which is acting as a support line, based on price action and candlestick patterns.
- The 7 EMA line should cross above the 21 EMA line.
- Enter a buy order on the confirmation of these conditions.
Stop Loss
- Set the stop loss below the support line.
Exit
- Set the Take Profit target a little below the resistance line above price.
Sell Trade Setup
Entry
- Price should show signs of price rejection from any of the Pivot Point lines, which is acting as a resistance line, based on price action and candlestick patterns.
- The 7 EMA line should cross below the 21 EMA line.
- Enter a sell order on the confirmation of these conditions.
Stop Loss
- Set the stop loss above the resistance line.
Exit
- Set the Take Profit target a little above the support line below price.
Conclusion on Pivot Points
Pivot Points is one of the most important indicators used by professional traders. Traders would often look for bounces off the Pivot point to determine a good trend reversal signal.
Although the strategy above uses a moving average crossover to determine an entry signal, many professional traders base their decision on price action. Traders who have developed the skill to anticipate trend reversals could make use of price action alone as a basis for entry signals.
It is also important to note that with Pivot Points, the key is in having the same line that other traders are looking at. Daily Pivot Points does work. However, because brokers are based on different countries and close on different times of the day, the lines plotted on different platforms could differ. For this reason, it is best to stick with the Weekly Pivot Points as they tend to be more reliable.
#5 – Keltner Channel Indicator
There are many things that traders need to look out for when trading the forex markets. Traders need to answer several questions before making a trade decision.
Where is the trend going? How volatile is the market? Is price overbought or oversold? Is there momentum behind a price movement? Is the market contracting or expanding?
There are so many things that traders need to consider, and it often causes confusion for those who are not used to it. Luckily, we have the Keltner Channel indicator.
The Keltner Channel indicator is a unique indicator because it gives traders all the information they need in order to make sound trade decisions.
It is based on a moving average so it could identify trend direction. It also has an element of the Average True Range (ATR) which allows it to show the volatility of the market. Because it is a channel type of indicator, it could also mark the areas which could be considered overbought or oversold. It could also identify strong momentum using the outer bands of the indicator. Because it could identify volatility and trend altogether, it could also indicate signs of a contracting or expanding market condition. Truly, the Keltner Channel is one of the most versatile technical indicators available.
The Keltner Channel is composed of three lines. The middle line is basically an Exponential Moving Average (EMA) set at 20 periods. The two lines enveloping the middle line are derived from the 20 EMA and the ATR. The upper line is plotted two ATRs above the 20 EMA line, while the lower line is plotted two ATRs below the 20 EMA line.
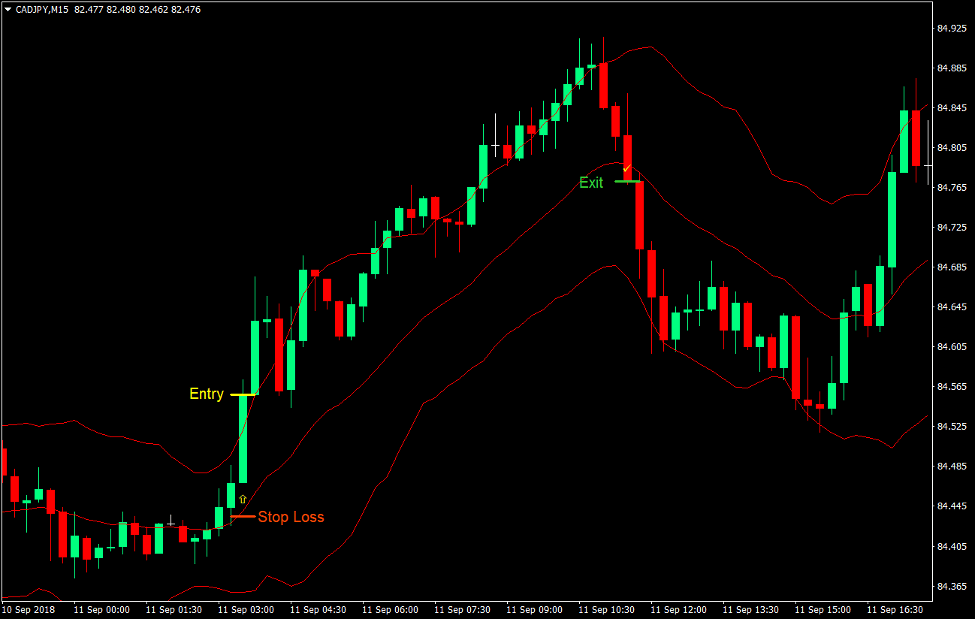
Keltner Channel Momentum Trading Strategy
The Keltner Channel is an excellent indicator to use for momentum strategies. The combination of the use of the ATR and the 20 EMA allows traders to identify momentum and trend quite effectively.
To trade this strategy, traders should identify strong price breakouts closing outside of the channel coming from a contraction phase. In a bullish momentum, price should close strongly above the upper band. In a bearish momentum, price should close strongly below the lower band.
As soon as price starts its strong momentum price movement, price would tend to stay close towards the outer bands. Trades are held until the trend has fizzled out which is marked by a contracting market phase and price closing in the middle of the channel.
Indicators:
- Kelnter_Chanel (default setting)
Preferred Time Frames: 15-minute, 30-minute, 1-hour, 4-hour and daily charts
Currency Pairs: major and minor pairs
Trading Sessions: Tokyo, London and New York sessions
Buy Trade Setup
Entry
- The market should be in a contraction phase characterized by small indecisive candles.
- A bullish momentum candle should close above the upper line of the Keltner Channel.
- The Keltner Channel should start to expand.
- Enter a buy order on the confirmation of these conditions.
Stop Loss
- Set the stop loss a few pips below the midline of the Keltner Channel.
Exit
- Close the trade as soon as price closes below the midline of the Keltner Channel.
Sell Trade Setup
Entry
- The market should be in a contraction phase characterized by small indecisive candles.
- A bearish momentum candle should close below the lower line of the Keltner Channel.
- The Keltner Channel should start to expand.
- Enter a sell order on the confirmation of these conditions.
Stop Loss
- Set the stop loss a few pips above the midline of the Keltner Channel.
Exit
- Close the trade as soon as price closes above the midline of the Keltner Channel.
Conclusion on the Keltner Channel
Momentum breakout trading strategies are one of the best types of trading strategies and using channel and envelope types of indicators are good for such type of strategies.
It allows traders to identify the contraction phase, the sudden influx of volume indicated by a momentum candle, and the continuation of the trend as price hugs the outer lines where the breakout occurred.
Although momentum breakout strategies and the Keltner Channel is an excellent fit, it is also a good idea to have other indicators to combine with it as an additional confirmation. Traders should also do some technical analysis, looking at the market cycles of contractions and expansions, the long-term trend, as well as the strength of the breakout.
Conclusion on Technical Indicators
Technical indicators provide traders an edge. It allows traders to be more accurate with their trades and gain higher yields on their winning trades. This is the recipe for consistent profits.
Although indicators do provide traders an edge, they are just ingredients to the whole recipe. Technical indicators are just part of a bigger picture. Traders should find profitable confluences between different indicators in order to come up with a winning strategy.
Traders who could objectively make decisions based on rules using technical indicators are the ones who could profit consistently from the forex market.
Recommended MT4 Brokers
XM Broker
- Free $50 To Start Trading Instantly! (Withdraw-able Profit)
- Deposit Bonus up to $5,000
- Unlimited Loyalty Program
- Award Winning Forex Broker
- Additional Exclusive Bonuses Throughout The Year

>> Sign Up for XM Broker Account here <<
FBS Broker
- Trade 100 Bonus: Free $100 to kickstart your trading journey!
- 100% Deposit Bonus: Double your deposit up to $10,000 and trade with enhanced capital.
- Leverage up to 1:3000: Maximizing potential profits with one of the highest leverage options available.
- ‘Best Customer Service Broker Asia’ Award: Recognized excellence in customer support and service.
- Seasonal Promotions: Enjoy a variety of exclusive bonuses and promotional offers all year round.

>> Sign Up for FBS Broker Account here <<
Click here below to download:
Hello Tim,
I really do enjoy all the information that you send me.
I love the Forex MT4 platform setup the best of all.
I am an old dog now, and just wish I had started Forex many years earlier as I get so much enjoyment using a small .o1 trading amount. I usually lose more money than I win.
One day I hope to invest in one of your best programs.
Once again, thankyou .
Rick Ashley