


Red Light – Green Light Forex Trading Strategy
Trading the forex markets or any trading markets for that matter is not an easy task. Imagine seeing a chart with bars, lines and numbers that seem to go anywhere it wants to on the chart, then your job is to predict where price is going. Not only do you have to pick the right direction, which in itself is already 50-50 chance, out of the hundreds or thousands of candles to choose from, you should be able to pick the right candle. That is no easy feat.
Other resort to just choosing any price and just get out of the market only when you are in profit, but that is a recipe for disaster. You could lose all your hard-earned profit anytime you pick that one wrong entry that could wipe out your account.
Other traders who have mastered the craft of picking the right entry have made thousands, even millions out of the forex market. But these people have put in so much time to master their craft and even then, these people are very few.
The Case for Custom Trading Indicators
Indicators are tools that help traders make sense of price charts that often times seem so vague. These are not the Holy Grails of trading, but it does help you make decisions.
There are many different types of indicators and for different purposes. Some indicators are placed on the price chart itself and help predict the areas where price might take interesting turns, bounce off, or reverse. These are the likes of the Bollinger Bands, moving averages, pivot points and its derivatives. All these indicators act as dynamic support and resistances, which given the right settings, price do respect.
Another type of indicator are the oscillating indicators. These are indicators that are placed on a separate window and often times give a clue as to the bias of the market’s direction. These are the likes of the MACDs, RSIs, stochastics, and all its derivatives. They do work, and many traders have one of them included in their trading strategies.
Perhaps one of the most fascinating type of custom indicator are those that pinpoint exactly when and where to enter the market. They are usually in the form of arrows or dots. Many of them don’t work too well, especially those that are based on fractals, but there are those that are just a gem and works with great accuracy. What I find to work best are those that appear when a confluence of many indicators occur and those that are based on momentum candles and shifts in momentum.
Trading Strategy Concept
With this trading strategy, we will explore an entry indicator that seems to work well and seems to be based on momentum. This indicator is called arrows and curves, however, for this strategy, we won’t be using the curves or the channel of this indicator. Instead we will be trading the arrows alone.
These arrows seem to be working well. It does have a decent accuracy rate. If you’d observe it closely, price usually goes the direction that the arrow is pointing for several candles, enough to allow traders to profit from it. However, its setback is that it seems a bit lagging. This is the tradeoff that you’d have to accept if you’d like more accuracy from this type of indicator.
We will be combining the above indicator with RSI filter custom indicator. This indicator seems to point the direction of the bias of the market based on the RSI indicator. A shift in the direction pointed usually occurs only when a spiking RSI going the opposite direction occurs.
So, we have an indicator that points the bias of the direction of the market and an indicator that pinpoints the exact entry that you should take. Plus, both indicators conveniently displays green bars and arrows for a buy entry and red bars and arrows for sell setups – thus we will call this strategy the Red Light – Green Light Strategy.
Timeframe: any
Currency Pair: any
Session: any
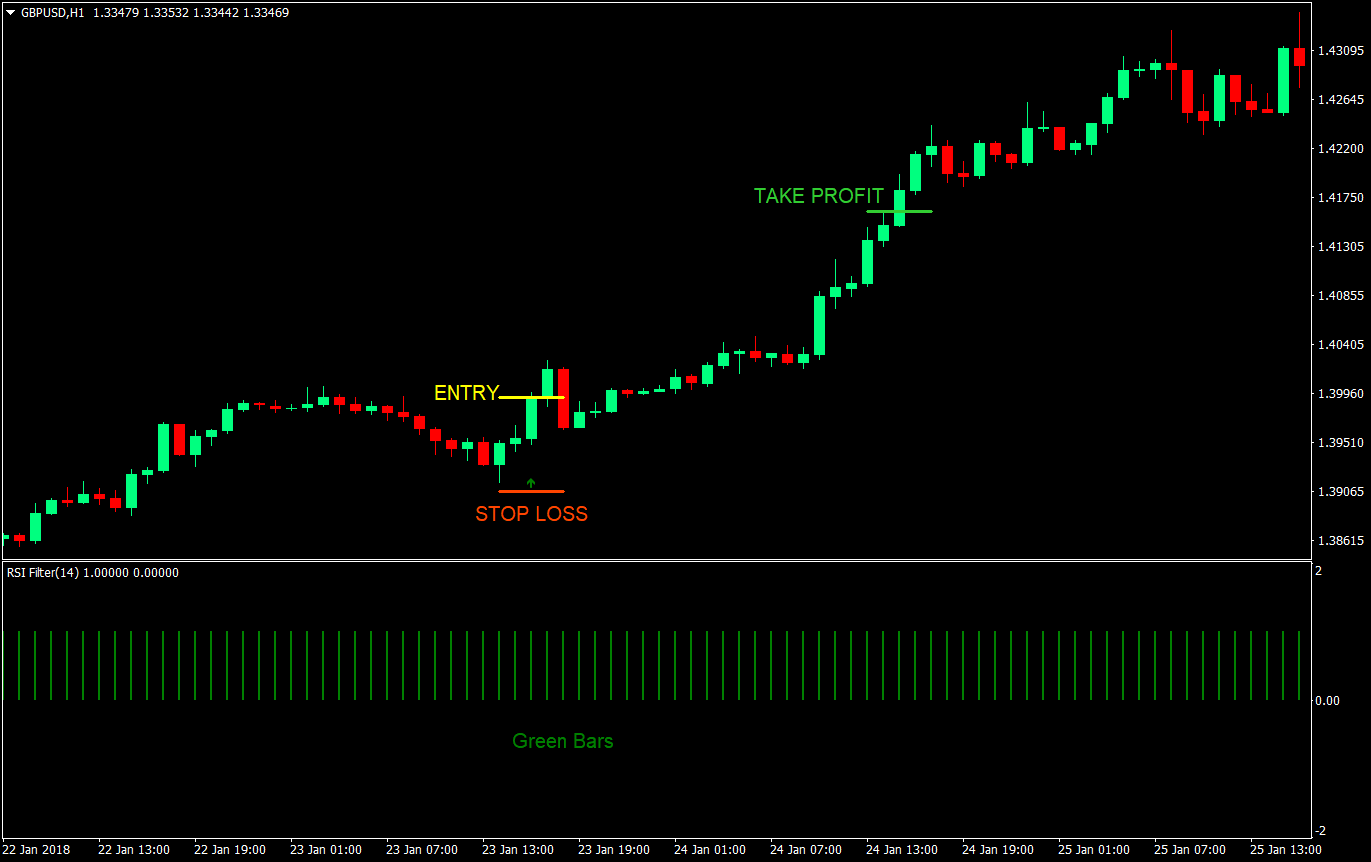
Buy (Long) Trade Rules
Entry
- RSI Filter indicator should be printing green bars indicating a bullish market bias
- Enter a buy market order at the close of the candle as soon as a green arrow pointing up is printed on the chart
Stop Loss
- Set the stop loss below the arrow
Take Profit
- Set the take profit target at 2x the risk on the stop loss
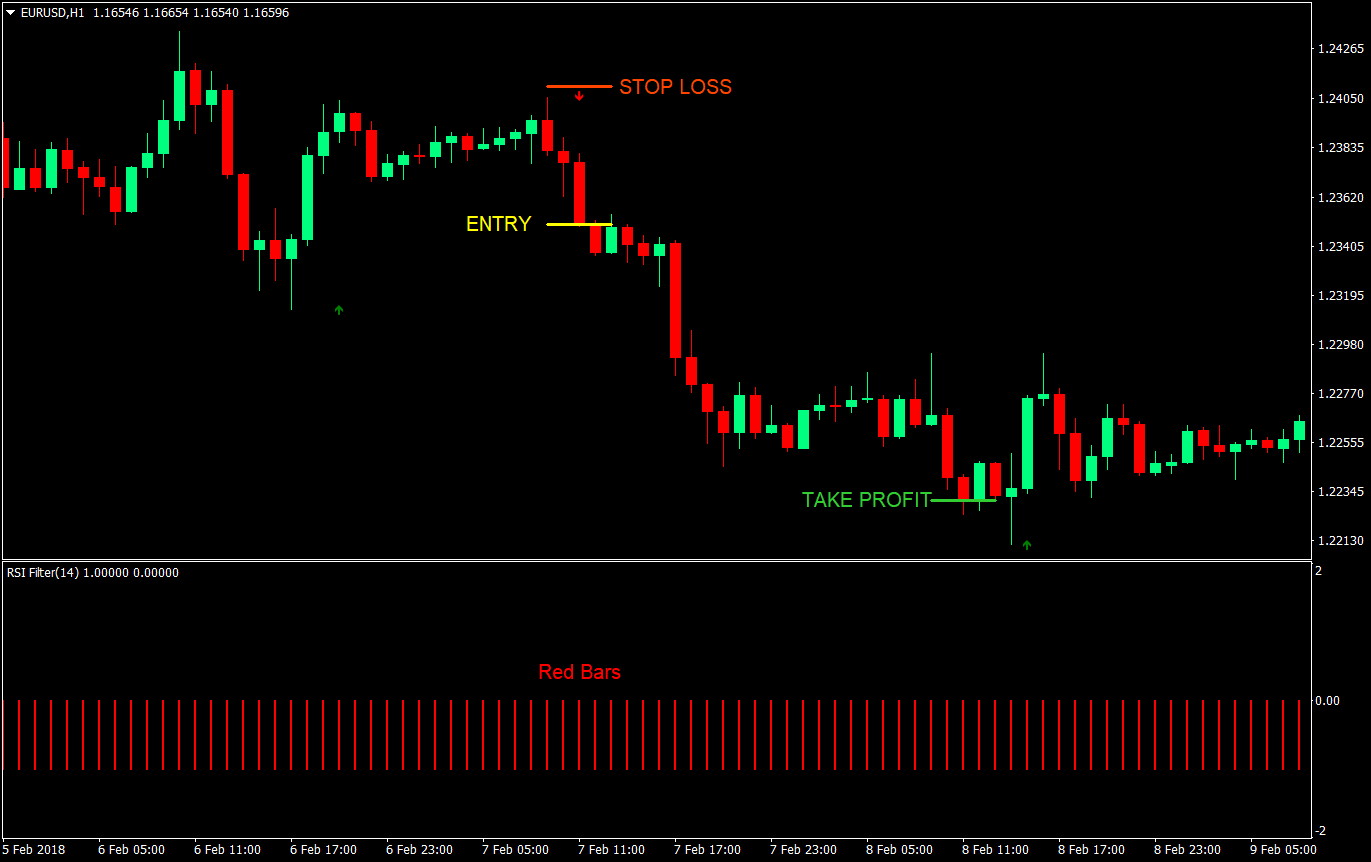
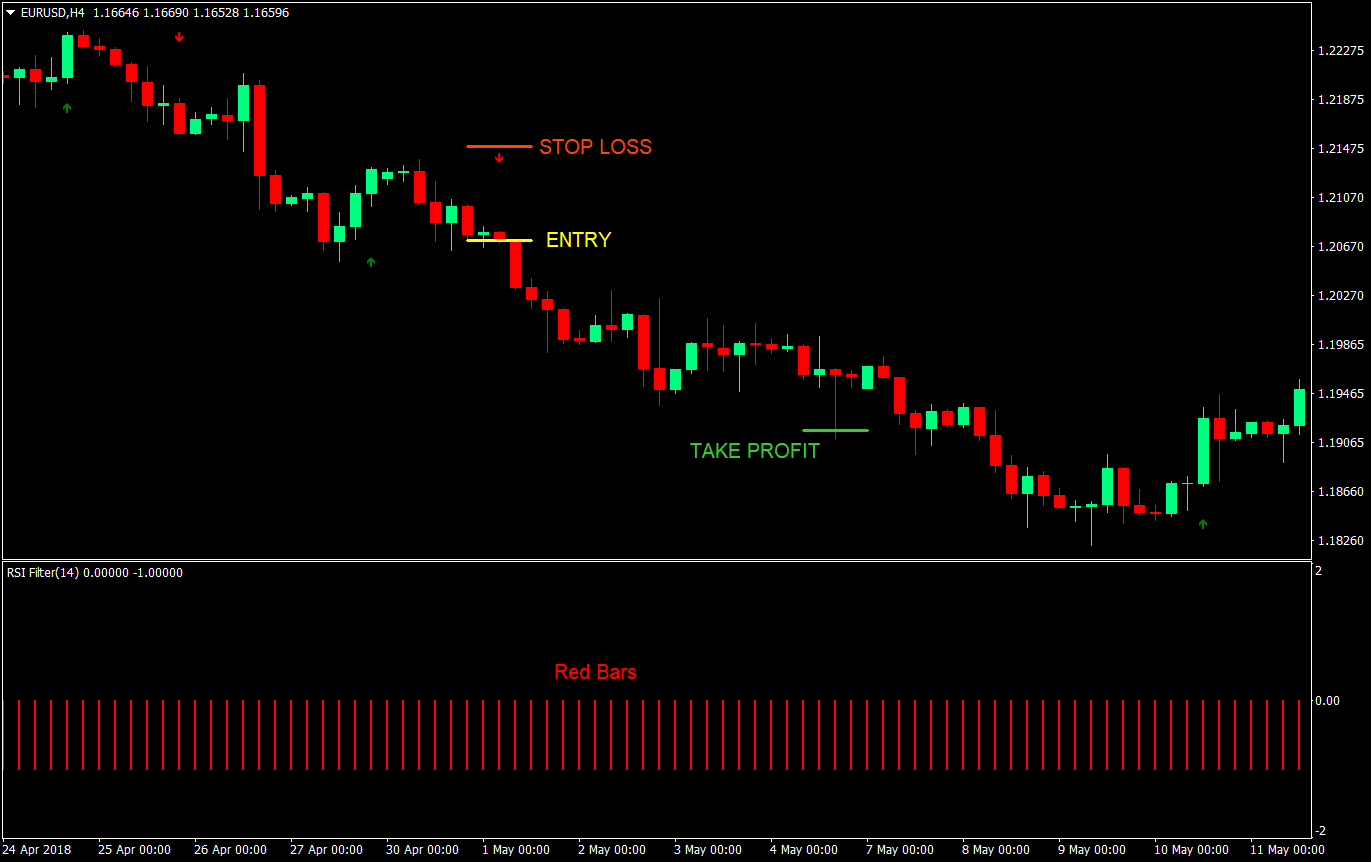
Sell (Short) Trade Rules
Entry
- RSI Filter indicator should be printing red bars indicating a bearish market bias
- Enter a sell market order at the close of the candle as soon as a red arrow pointing down is printed on the chart
Stop Loss
- Set the stop loss above the arrow
Take Profit
- Set the take profit target at 2x the risk on the stop loss
Conclusion
This strategy is a very simplistic strategy based on two working indicators. The magic is mostly on the arrow entry indicator. Most of the entry signals it generates do go towards the direction it is pointing. However, it doesn’t have as much accuracy trading countertrends. This is the reason why we are using a secondary indicator that gives us an indication with regards to the general direction that the market is biased to be going.
This is a working strategy that could produce profits as it is. You could tweak it, replace target take profit multiples, stop loss strategies, and even replace the RSI filter indicator with another indicator that points the markets trend bias. Just keep the arrows intact, test, and make it your own.
Recommended MT4 Broker
- Free $50 To Start Trading Instantly! (Withdrawable Profit)
- Deposit Bonus up to $5,000
- Unlimited Loyalty Program
- Award Winning Forex Broker
- Additional Exclusive Bonuses Throughout The Year

>> Claim Your $50 Bonus Here <<
Click here below to download: