


As estratégias de crossover são provavelmente um dos tipos mais populares de estratégias de negociação que os traders encontram. Quase todos os traders encontrariam este tipo de estratégia de negociação. Isto é especialmente verdadeiro com novos traders. Isso ocorre porque as estratégias de cruzamento são tão fáceis de implementar que qualquer pessoa pode fazê-lo. Contanto que você consiga identificar duas linhas se cruzando, você está pronto para prosseguir.
Porém, estratégias de crossover, mesmo com sua simplicidade, não são tão fáceis. Os traders seriam frequentemente apanhados numa situação em que chegavam tarde demais para entrar numa negociação ou em que realizavam negociações num mercado que não está a reverter. Isto muitas vezes faz com que os traders tenham perdas sucessivas porque estas condições de mercado são comuns no mercado. Essas condições são chamadas de mercados agitados ou variados. Os mercados agitados tendem a não mostrar uma direção clara e oscilam para frente e para trás sem iniciar uma tendência. Os mercados variados são um pouco mais definidos em comparação com os mercados agitados, mas os preços ainda se movem dentro de uma faixa fixa.
As estratégias de cruzamento são mais adequadas para um único tipo de condição de mercado. Estas são condições de mercado de reversão de tendência. Durante estes tipos de condições, os traders que entraram na negociação no início da tendência e saíram no final da tendência obtêm enormes lucros.
Kalman Filter Cross Forex Trading Strategy é uma estratégia de reversão de tendência que fornece sinais de negociação com base em cruzamentos de médias móveis modificadas e uma confirmação de uma vela de impulso. Isto dá às configurações de negociação a vantagem de ter aquele impulso inicial proveniente de uma vela dinâmica no início da negociação, o que muitas vezes faz com que o mercado mude de tendência.
HMA v2
HMA basicamente significa Hull Moving Average. HMA v2 é um indicador técnico de tendência que se baseia em uma média móvel.
A maioria das médias móveis sofre de uma desvantagem comum. Ou a linha da média móvel está muito atrasada ou é facilmente suscetível a sinais falsos provenientes de condições de mercado agitadas.
Uma média móvel muito atrasada muitas vezes faria com que os traders entrassem e saíssem de uma negociação tarde demais, fazendo com que perdessem dinheiro em uma configuração de negociação que de outra forma seria lucrativa.
Por outro lado, uma média móvel sem suavização cruzaria facilmente com o preço ou quaisquer outros sinais, mesmo quando a tendência não fosse claramente revertida. Isso faria com que os comerciantes realizassem negociações que não deveriam ser válidas.
O HMA v2 consegue suavizar sua linha de média móvel e, ao mesmo tempo, torná-la mais responsiva aos movimentos de ação de preços. Isto nos dá uma linha de média móvel que causa menos sinais falsos e, ao mesmo tempo, permite que os traders reajam às reversões de tendência de forma mais eficaz.
O indicador HMA v2 traça uma série de pontos no gráfico de preços para mostrar o movimento da linha HMA. Os pontos mudam de cor dependendo da direção da tendência. Uma linha azul clara indica uma tendência de alta, enquanto uma linha de tomate indica uma tendência de baixa.
Filtro de Kalman
À primeira vista, um trader pensaria que o Filtro de Kalman é apenas mais uma média móvel modificada, mas não é.
A filtragem de Kalman, também conhecida como Estimativa Quadrática Linear (LQE), é um algoritmo que usa uma série de dados históricos, que contém ruído estatístico, e produz uma estimativa que geralmente é mais precisa do que aquelas comparadas com outras formas de medições baseadas em uma única medição.
No caso da negociação forex, os dados históricos utilizados são movimentos históricos de preços. Esses movimentos de preços apresentam ruído, que é muito prevalente no mercado.
Quando comparado com a média móvel tradicional, o Filtro de Kalman se parece com uma linha de média móvel normal. No entanto, os traders podem notar que o Filtro de Kalman se move de forma mais suave em comparação com a maioria das linhas de média móvel, mas ao mesmo tempo responde melhor aos movimentos de preços.
O indicador Filtro de Kalman traça uma linha para indicar a direção da tendência. Esta linha muda de cor dependendo da direção da tendência. Uma linha turquesa indica uma tendência de alta, enquanto uma linha laranja indica uma tendência de baixa.
Estratégia de Negociação
Esta estratégia de negociação é uma estratégia de negociação de reversão de tendência que negocia em cruzamentos entre os pontos HMA v2 e o Filtro de Kalman. No entanto, em vez de negociar no cruzamento real dos dois indicadores, espera por algumas confirmações.
O cruzamento entre os dois muitas vezes significaria que os pontos HMA v2 já mudaram de cor ou estão mudando de cor durante o cruzamento. No entanto, o Filtro de Kalman não muda de cor imediatamente. Ele aguarda uma confirmação construída em seu algoritmo antes de mudar de cor. As configurações de negociação válidas devem ter a cor da linha do Filtro Kalman alterada antes de entrar na negociação.
Além disso, os traders também devem considerar as características da ação do preço. Uma vela de impulso deve ser formada para aumentar a confiança de que o preço poderá reverter.
Indicadores:
- HMA_v2
- Período HMA: 70
- Filtro_Kalman
Prazos preferidos: Gráficos de 1 hora, 4 horas e diários
Pares de moedas: FX maiores, menores e cruzes
Sessões de negociação: Sessões em Tóquio, Londres e Nova York
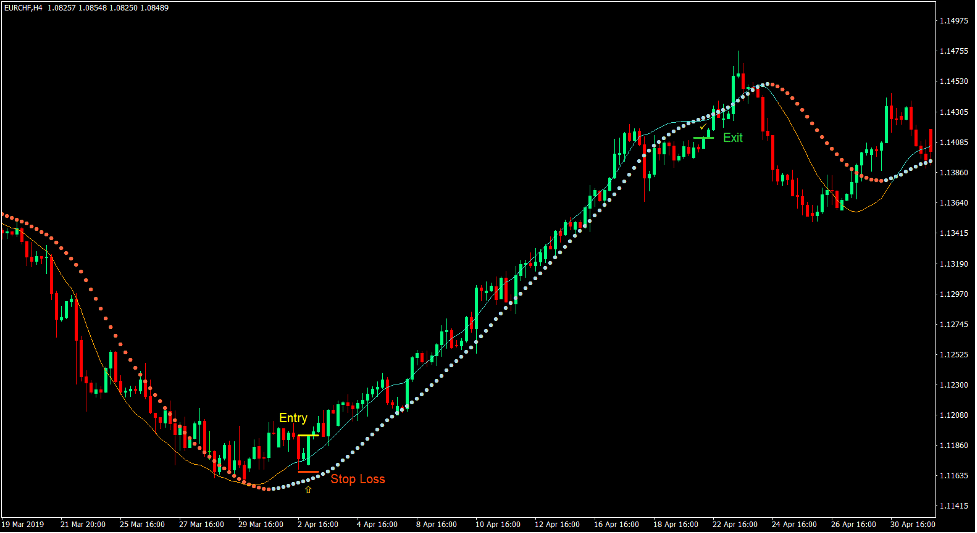
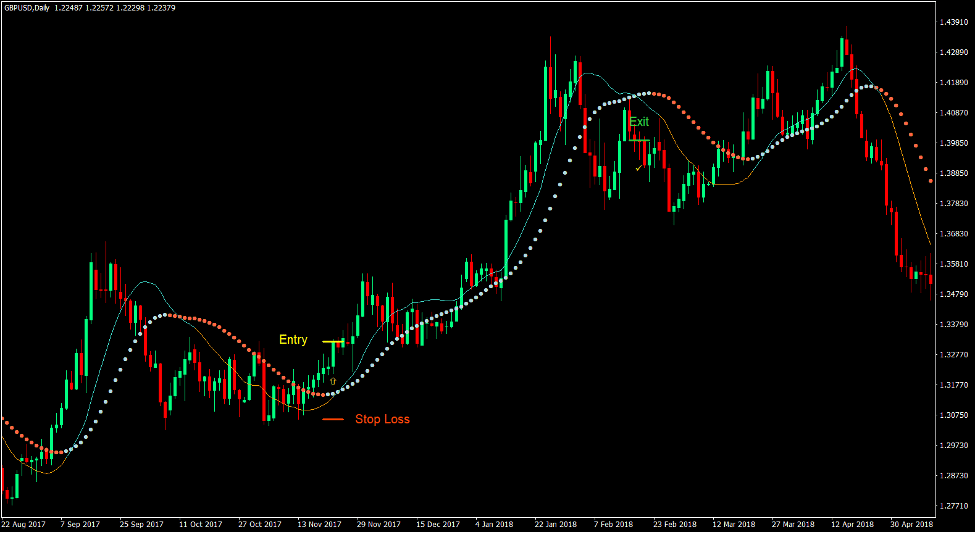
Comprar configuração comercial
entrada
- Os pontos do HMA v2 devem mudar para azul claro.
- A linha do Filtro Kalman deve cruzar acima dos pontos HMA v2.
- A linha do Filtro Kalman deve mudar para turquesa.
- Uma vela de impulso de alta deve ser formada.
- Insira uma ordem de compra após a confirmação dessas condições.
Stop Loss
- Defina o stop loss no fractal abaixo da vela de entrada.
saída
- Feche a negociação assim que a linha do Filtro de Kalman cruzar abaixo dos pontos HMA v2.
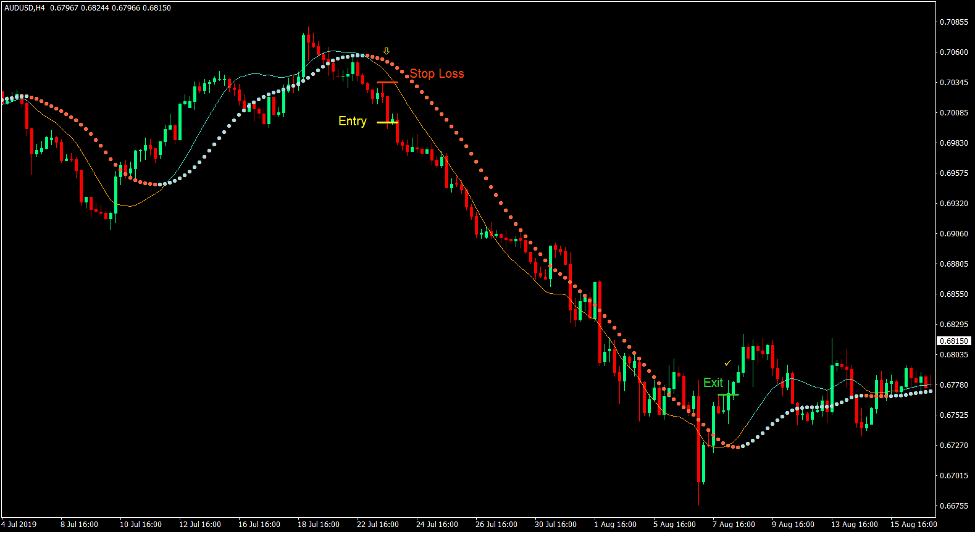
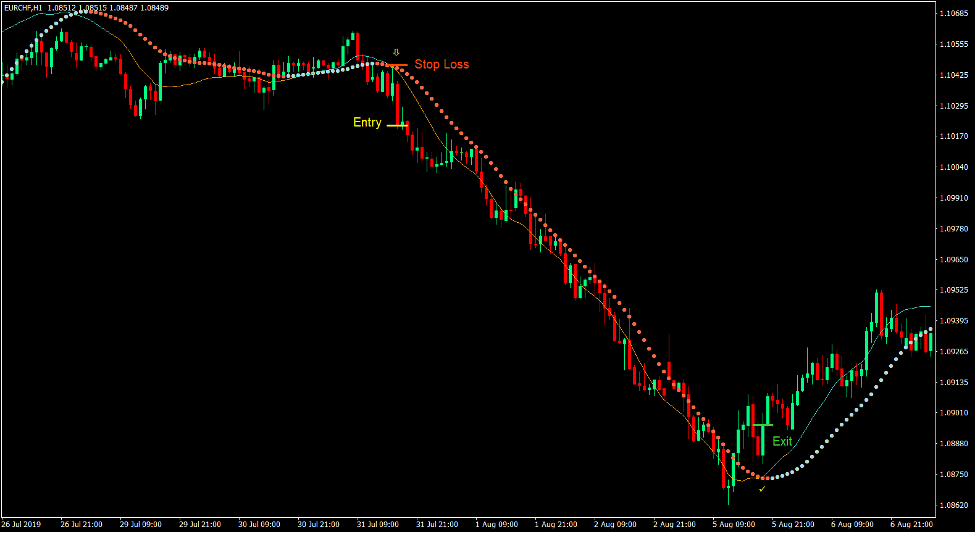
Configuração de venda de comércio
entrada
- Os pontos do HMA v2 devem mudar para tomate.
- A linha do Filtro Kalman deve cruzar abaixo dos pontos HMA v2.
- A linha do Filtro Kalman deve mudar para laranja.
- Uma vela de impulso de baixa deve ser formada.
- Insira uma ordem de venda após a confirmação dessas condições.
Stop Loss
- Defina o stop loss no fractal acima da vela de entrada.
saída
- Feche a negociação assim que a linha do Filtro de Kalman cruzar acima dos pontos HMA v2.
Conclusão
Esta estratégia de inversão de tendência que se baseia no cruzamento destes dois indicadores é uma estratégia que poderia potencialmente produzir rendimentos enormes. Isso ocorre porque as configurações comerciais podem ocorrer desde o início da tendência até o momento em que a tendência se inverte.
No entanto, como a maioria das estratégias de cruzamento, existem períodos em que é suscetível a sinais falsos. Isso ocorre sempre que o mercado fica instável. Durante estas condições, é melhor evitar negociar esta estratégia. Negocie esta estratégia apenas quando o mercado tende a produzir grandes oscilações que resultam em tendências.
Corretores MT4 recomendados
Corretora XM
- $ 50 livre Para começar a negociar instantaneamente! (Lucro que pode ser retirado)
- Bônus de depósito até $5,000
- Programa de fidelidade ilimitado
- Corretor de Forex premiado
- Bônus Exclusivos Adicionais Ao longo do ano

>> Cadastre-se para uma conta XM Broker aqui <
Corretor FBS
- Bônus de negociação de 100: $100 grátis para iniciar sua jornada de negociação!
- 100% Bónus de Depósito: Duplique seu depósito até US$ 10,000 e negocie com capital aumentado.
- Alavancagem até 1: 3000: Maximizando os lucros potenciais com uma das opções de alavancagem mais altas disponíveis.
- Prêmio de 'Melhor Corretora de Atendimento ao Cliente da Ásia': Excelência reconhecida em suporte e atendimento ao cliente.
- Promoções sazonais: Aproveite uma variedade de bônus exclusivos e ofertas promocionais durante todo o ano.

>> Cadastre-se para obter uma conta de corretor FBS aqui <
Clique aqui abaixo para fazer o download: