


Price Pattern Trading is a basic technical trading strategy which many seasoned traders use. However, identifying such patterns is often quite daunting for newer traders, especially because identifying these patterns is often very subjective. It requires skill and experience to effectively identify these patterns with high accuracy.
The strategy which is about to be discussed below provides a simplified method for trading two of the most popular reversal price patterns.
Double Top and Double Bottom Reversal Trading Pattern
Double Tops and Double Bottoms are two of the most popular trading patterns that many traders use. These two patterns are high probability momentum reversal trading patterns that can easily be identified and traded.
Double Tops are bearish reversal patterns which resemble the “M” pattern. The two peaks or tops that form the “M” pattern are swing highs which have price levels that have relatively small differences compared to the other swing highs. This pattern indicates that on the second peak, the market is rejecting the price level near the prior swing high. This is a telltale sign of price rejection which typically results in a strong bearish reversal.
The Double Bottoms on the other hand are the exact opposite. This pattern resembles a “W” pattern wherein the two dips of price action form the bottom of the “W” pattern. Inversely, the second dip also indicates a rejection of the price level near the swing low of the first bottom. This in turn indicates a possible bullish reversal.
The visual below shows us how the Double Top and Double Bottom patterns should look like.
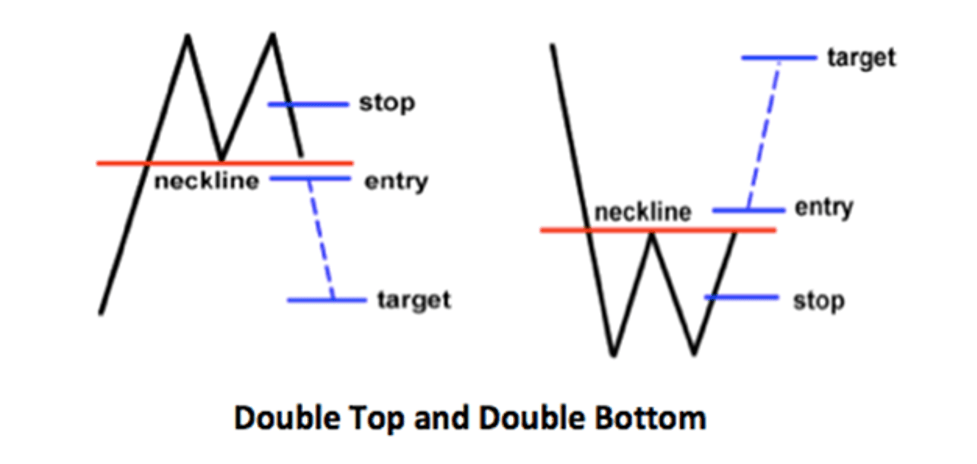
Double Tops and Double Bottoms are typically traded at the break of the neckline. In the case of the Double Top, traders would wait for price to break below the neckline and trade with the momentum moving down. As for the Double Bottoms, traders would usually trade at the break above the neckline assuming a strong momentum moving up.
Although Double Tops and Double Bottoms should ideally have tops and bottoms which have levels that are quite close to each other, this is not always the case. The market moves dynamically and as such these patterns are often not as perfect as we would hope.
Newer traders also typically find it difficult to objectively identify Double Tops and Double Bottoms. Again, this is because of the dynamic nature of price action. Proficiency in identifying these patterns usually come with experience.
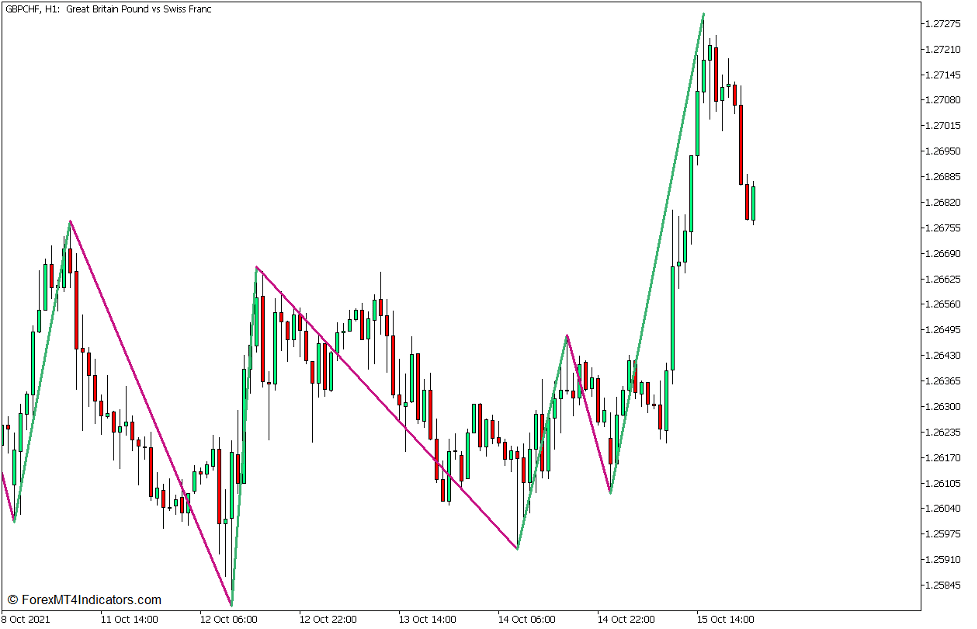
Zigzag 2 R Color Indicator
The Zigzag 2 R Color Indicator is a custom technical indicator which was developed to help traders identify swing highs and swing lows.
The Zigzag 2 R Color Indicator identifies swing highs and swing lows by comparing the momentum of price reversals with a pre-determined depth and deviation threshold. For example, if the indicator has set the thresholds to be at a depth of 12 and a deviation of 5, the indicator would consider the succeeding swing high or swing low as valid if it breaches these thresholds.
As soon as the indicator identifies a valid swing high or swing low, it would then plot a line connecting the points between a swing high and a swing low. This creates the distinctive zigzag pattern which is overlaid on the price chart.
The Zigzag 2 R Color Indicator has a unique feature compared to the basic Zigzag Indicator because the color of its lines change depending on the direction of the momentum. It plots a violet-red line whenever it is connecting a swing high towards a swing low. On the other hand, the line it plots would be green whenever it would connect a swing low to a swing high.
Trading Strategy Concept
The Zigzag Color Double Top and Double Bottom Forex Trading Strategy is a simple pattern trading strategy which trades reversals using the Double Top and Double Bottom patterns.
Using the Zigzag 2 R Color Indicator, traders may objectively identify valid swing highs and swing lows as plotted by the indicator. Traders should then observe for valid Double Tops and Double Bottoms which have swing highs and swing lows that are relatively closer to each other. Traders should then wait for a strong break of the neckline as this is the standard method for trading Double Tops and Double Bottoms. However, instead of trading on the breakouts immediately, we would rather wait for a pullback on the broken neckline area. Trade entries may be considered valid only when there is a price rejection as price pulls back towards the broken neckline area.
Buy Trade Setup
Entry
- Identify a valid Double Bottom using the Zigzag 2 R Color Indicator.
- The bottoms of the pattern should be close to each other.
- Wait for a strong momentum break above the neckline.
- Wait for price to pullback towards the area of the broken neckline.
- Open a buy order as soon as price action shows signs of price rejection on the area of the broken neckline.
Stop Loss
- Set the stop loss on the minor support area below the entry candle.
Exit
- Set the take profit target on the next swing high above the broken neckline.

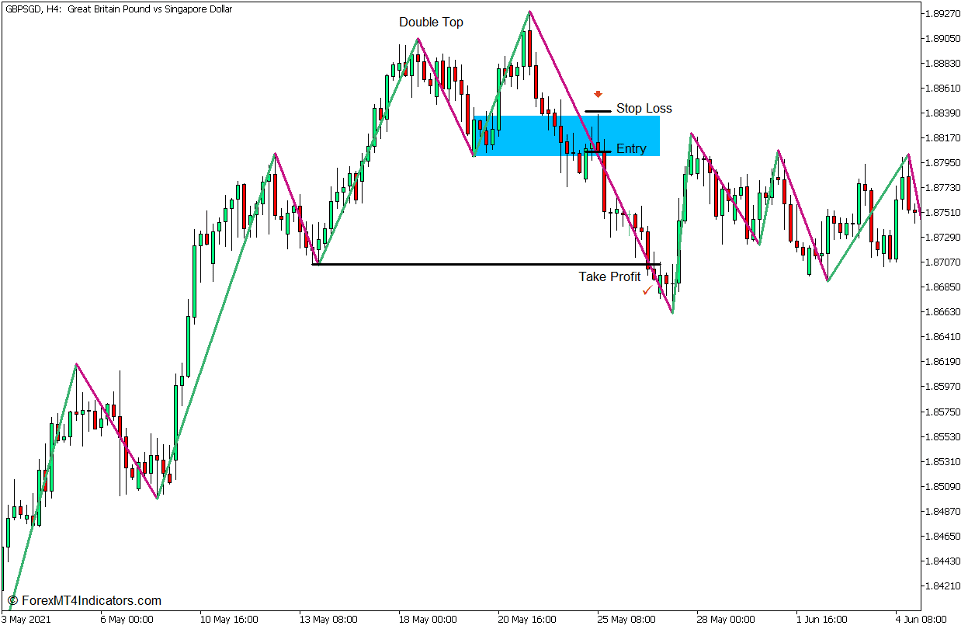
Sell Trade Setup
Entry
- Identify a valid Double Top using the Zigzag 2 R Color Indicator.
- The tops of the pattern should be close to each other.
- Wait for a strong momentum break below the neckline.
- Wait for price to pullback towards the area of the broken neckline.
- Open a sell order as soon as price action shows signs of price rejection on the area of the broken neckline.
Stop Loss
- Set the stop loss on the minor resistance area above the entry candle.
Exit
- Set the take profit target on the next swing low below the broken neckline.
Conclusion
Double Tops and Double Bottoms are valid reversal trading patterns which many traders use. However, many traders also overlook these patterns as it is often difficult to effectively identify these patterns in a live trading chart. The Zigzag 2 R Color Indicator simplifies this process by helping traders objectively identify valid swing highs and swing lows, allowing traders to easily spot possible Double Top and Double Bottom patterns.
Recommended MT5 Brokers
XM Broker
- Free $50 To Start Trading Instantly! (Withdraw-able Profit)
- Deposit Bonus up to $5,000
- Unlimited Loyalty Program
- Award Winning Forex Broker
- Additional Exclusive Bonuses Throughout The Year

>> Sign Up for XM Broker Account here <<
FBS Broker
- Trade 100 Bonus: Free $100 to kickstart your trading journey!
- 100% Deposit Bonus: Double your deposit up to $10,000 and trade with enhanced capital.
- Leverage up to 1:3000: Maximizing potential profits with one of the highest leverage options available.
- ‘Best Customer Service Broker Asia’ Award: Recognized excellence in customer support and service.
- Seasonal Promotions: Enjoy a variety of exclusive bonuses and promotional offers all year round.

>> Sign Up for FBS Broker Account here <<
Click here below to download: