


Introduction to the Stochastic RSI Indicator
Oscillators are some of the most widely used type of technical indicators used for identifying overbought and oversold price levels and its potential mean reversals. Among the various oscillators, the Stochastic Oscillator and the Relative Strength Index are two of the most popular oscillators.
The Stochastic RSI Indicator is an indicator which combines both indicators providing a smooth yet responsive oscillation as well as accurate signals.
What is the Stochastic RSI Indicator?
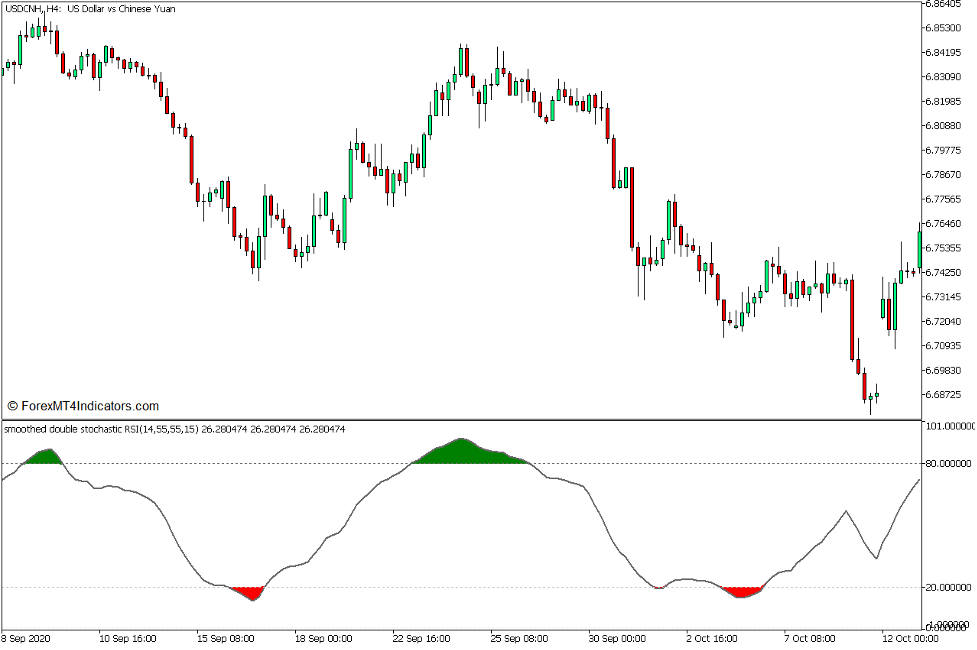
The Stochastic RSI Indicator is a modification of the classic Relative Strength Index (RSI) indicator and adds elements of the Stochastic Oscillator (SO) with it.
It plots a line which oscillates within the range of zero to 100 and has markers at levels 20 and 80. The area below 20 indicates an oversold market level, while the area above 80 indicates an overbought market. This indicator also shades the line red whenever it drops below 20 and green whenever it breaches above 80.
How the Stochastic RSI Indicator Works?
The Stochastic RSI Indicator uses a formula which somehow similar to the classic RSI. The difference is that the Relative Strength (RS) element of the formula is modified by adding a look back period. This look back period is calculated as the five day standard deviation of a 10-bar Simple Moving Average (SMA).
How to use the Stochastic RSI Indicator for MT5
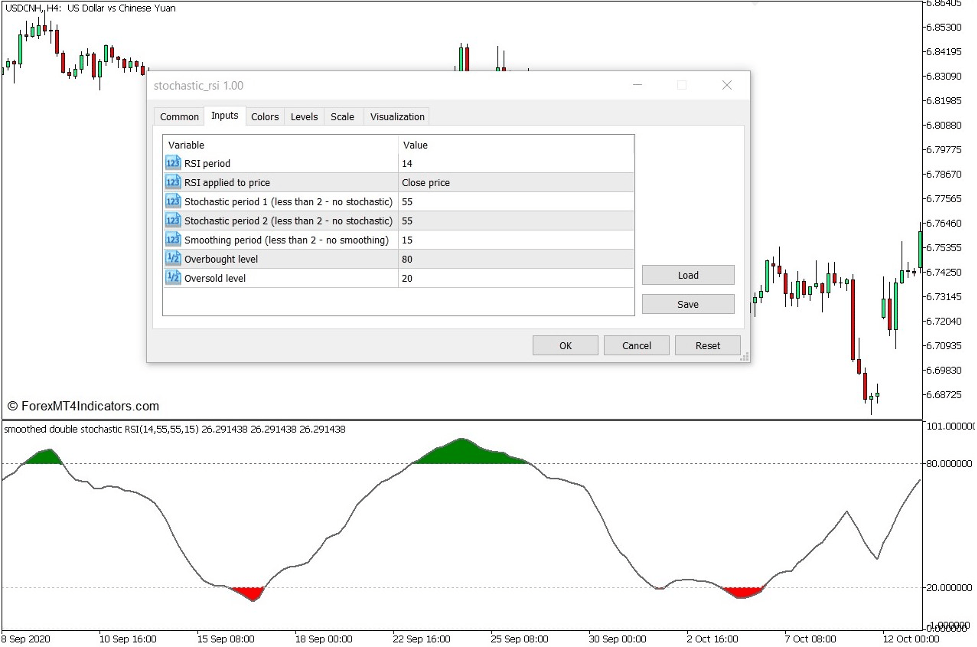
This indicator has several variables within its indicator settings which can be used to modify its sensitivity.
“RSI Period” refers to the number of bars used by the formula.
“RSI applied to price” refers to the price point on each bar which would be used for the formula. This is preset as the close price of each bar.
“Stochastic period 1”, “Stochastic period 2”, and “Smoothing period” modifies the smoothness of the indicator and may also contract the oscillations of the line.
“Overbought level” and “Oversold level” adjusts the overbought and oversold marker levels.
This indicator is best used as a mean reversal indicator. Traders may identify the oversold and overbought levels based on the levels 20 and 80 markers. Traders can take the crossing of the Stochastic RSI line towards the area between the 20 and 80 range as an indication of a mean reversal.
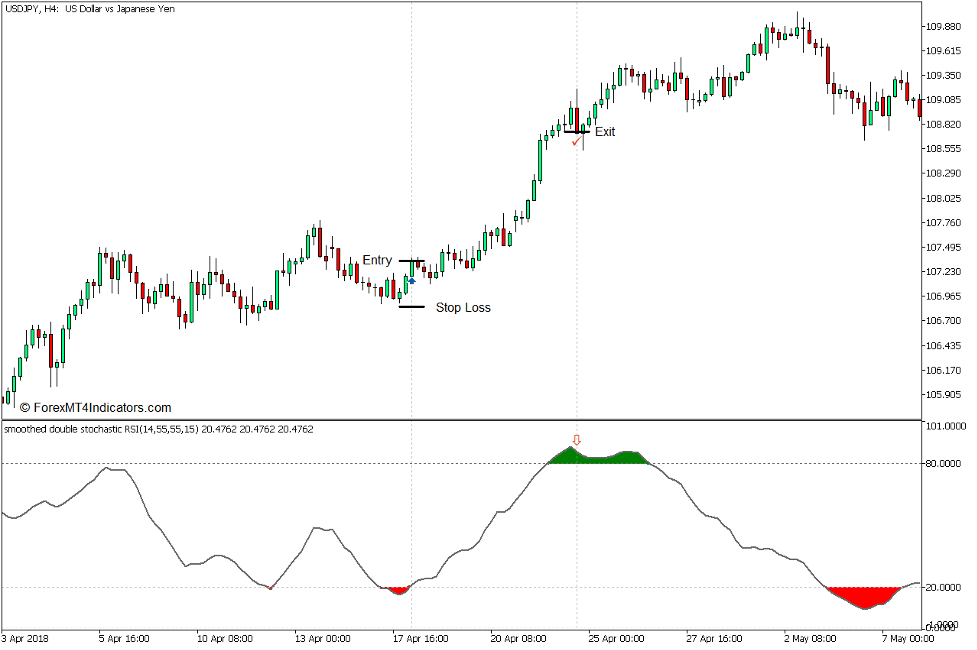
Buy Trade Setup
When to Enter?
Wait for the Stochastic RSI to drop below 20. Open a buy order as soon as the Stochastic RSI line crosses above 20. Set the stop loss on the support below the entry candle.
When to Exit?
Close the trade as soon as the Stochastic RSI line breaches above 80 and starts to curl down.
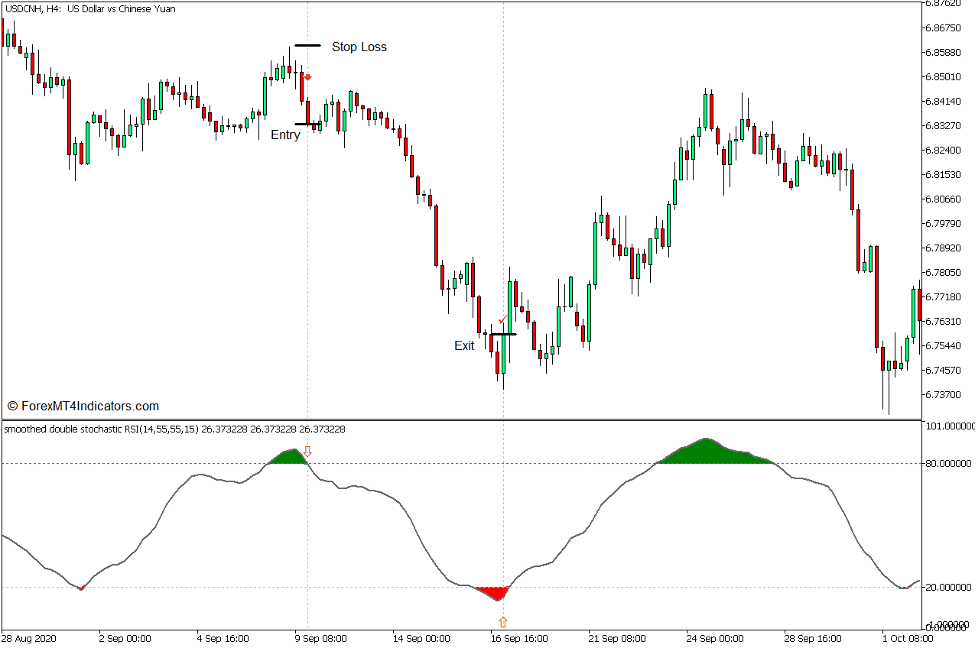
Sell Trade Setup
When to Enter?
Wait for the Stochastic RSI to breach above 80. Open a sell order as soon as the Stochastic RSI line crosses below 80. Set the stop loss on the resistance above the entry candle.
When to Exit?
Close the trade as soon as the Stochastic RSI line drops below 20 and starts to curl up.
Conclusion
This indicator is a very effective mean reversal signal indicator. Its signals tend to be more accurate compared to most oscillators. However, it is not perfect and should still be paired with other technical indications for better accuracy.
Recommended MT5 Brokers
XM Broker
- Free $50 To Start Trading Instantly! (Withdraw-able Profit)
- Deposit Bonus up to $5,000
- Unlimited Loyalty Program
- Award Winning Forex Broker
- Additional Exclusive Bonuses Throughout The Year

>> Sign Up for XM Broker Account here <<
FBS Broker
- Trade 100 Bonus: Free $100 to kickstart your trading journey!
- 100% Deposit Bonus: Double your deposit up to $10,000 and trade with enhanced capital.
- Leverage up to 1:3000: Maximizing potential profits with one of the highest leverage options available.
- ‘Best Customer Service Broker Asia’ Award: Recognized excellence in customer support and service.
- Seasonal Promotions: Enjoy a variety of exclusive bonuses and promotional offers all year round.

>> Sign Up for FBS Broker Account here <<

(Free MT5 Indicators Download)
Click here below to download: