


There are many ways to trade the market. Some traders use pure price action with naked charts. Others use a variety of technical indicators. Many use trend following strategies, while some trade range bound strategies. Others trade momentum strategies while others trade mean reversals. All these types of strategies could work if used by the right trader. As they say, there are many ways to skin a cat.
Although these trading strategies have glaring differences, there are also many trade setups and scenarios wherein these different strategies could overlap. Traders with varying trading strategies would have different reasons and different strategies behind a trade, yet they could still trade the same currency pair at the same entry point.
Trading is all about probabilities. One of the best ways to improve your trading probabilities is by looking for confluences. Although it is perfectly fine to trade confluences based on individual rules or indicators, it is also possible to confirm a trade setup with varying strategic reason.
Rockstar Bollinger Band Forex Trading Strategy is a strategy that combines both trend reversals and momentum trading strategies. It identifies possible trend reversals using the concept of a crossover strategy. It also confirms momentum by observing for momentum candles signaling the beginning of an expansion phase right after a market contraction phase.
MUV indicator
The MUV indicator is a custom technical indicator based on moving averages. It is a modified moving average which plots a moving average line which is characteristically very responsive to price action, while at the same time is smoothened out to avoid unwanted false signals.
The MUV indicator line can be used just as a regular moving average is use. It can be used to identify trend bias based on the location of price in relation to the MUV line or based on the slope of the line. It can also be used to identify trend reversals by pairing it with another moving average line and using it as a crossover signal indicator.
Bollinger Bands
The Bollinger Bands is a widely used technical indicator which is a part of the channel or band type of indicator.
The Bollinger Bands indicator plot three lines. The middle line is a Simple Moving Average (SMA) line. The outer two lines are standard deviations from the middle line usually set at +/-2 standard deviations.
The three lines mentioned above form a channel or band type structure which envelopes price action. These three lines act as dynamic support and resistance lines where price could either bounce from or breakout of.
Trend following traders use the slope of the middle line to identify trend direction. Mean reversal traders use the outer bands as a basis for overbought and oversold market conditions and trade bounces from these levels. Momentum traders identify momentum candles breaking outside of the bands as a momentum trade setup. The bands can also be used to identify volatility based on the contraction and expansion of the outer bands.
Rads MACD
The Rads MACD is a custom technical indicator based on the classic Moving Average Convergence and Divergence (MACD) indicator.
The traditional MACD is an oscillator type of indicator which computes for the difference between two moving average lines. The difference is then plotted on a separate window. Then, a signal line which is derived from the MACD line is then plotted trailing the MACD line. This line is a moving average of the prior MACD line.
Crossovers between the two lines indicate a possible trend reversal. The lines can also be used to identify oversold or overbought conditions based on its distance from the midline, which is zero, compared to prior swing points.
Rads MACD is a modified version of the MACD. It makes use of modified moving averages to compute for the underlying MACD and signal lines. Instead of plotting the two lines, it instead plots the difference between the two lines, making it simpler for traders to identify possible trend reversal signals. The color of the bars also indicate the strengthening and weakening of the trend. Positive lime bars indicate a strengthening bullish trend while positive red bars indicate a weakening bullish trend. Negative red bars indicate a strengthening bearish trend while negative lime bars indicate a weakening bearish trend.
Trading Strategy
This strategy is a combination of a crossover trend reversal strategy and a momentum trading strategy.
The crossover trade setup is identified based on the crossing over of the MUV line and the midline of the Bollinger Bands, which is also a Simple Moving Average line. This will signal a probable trend reversal which should alert us for a probable trade setup.
The Rads MACD indicator should also confirm the trend reversal based on the shifting of the histogram bars. The color of the bars should also indicate a strengthening fresh trend.
The momentum signal is based on a momentum candle closing strongly outside of the Bollinger Bands. These momentum signals should also come after a prior market contraction phase, which could also be identified based on the contraction and expansion of the Bollinger Bands.
Indicators:
- MUV
- Bollinger Bands
- Period: 36
- Rads_MACD
Preferred Time Frames: 1-hour, 4-hour and daily charts
Currency Pairs: FX majors, minors and crosses
Trading Sessions: Tokyo, London and New York sessions
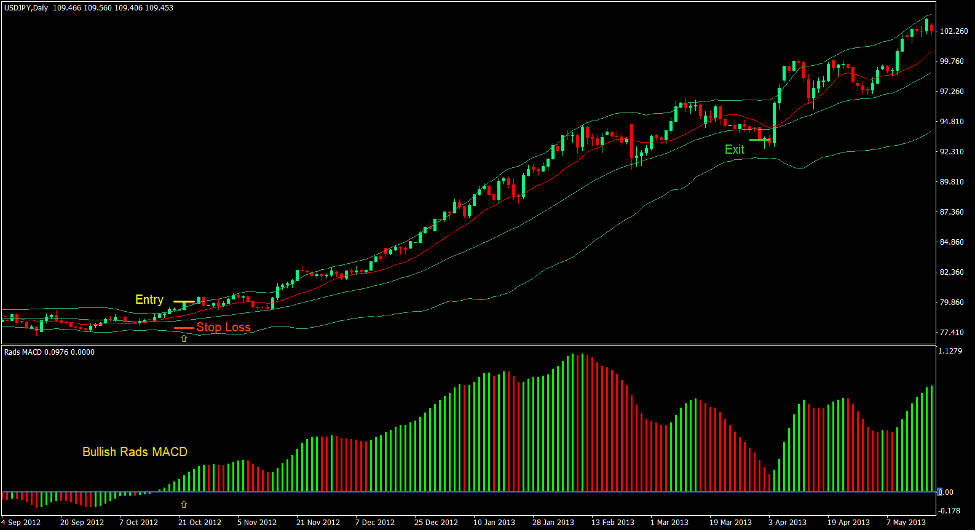
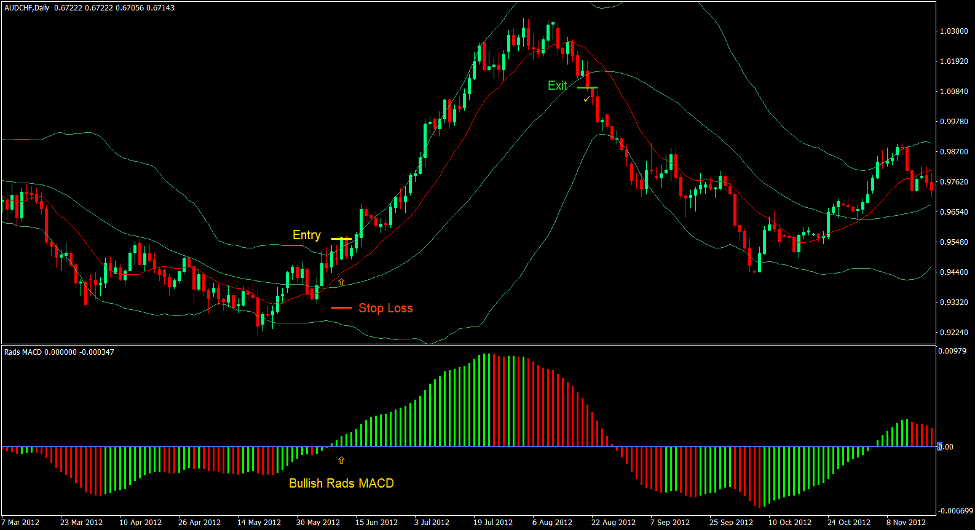
Buy Trade Setup
Entry
- The MUV line should cross above the midline of the Bollinger Bands.
- The Rads MACD histogram bars should cross above zero and should be lime.
- A bullish momentum candle should close above the upper Bollinger Bands.
- Enter a buy order on the confirmation of these conditions.
Stop Loss
- Set the stop loss on the support below the entry candle.
Exit
- Close the trade as soon as price closes below the midline of the Bollinger Bands.
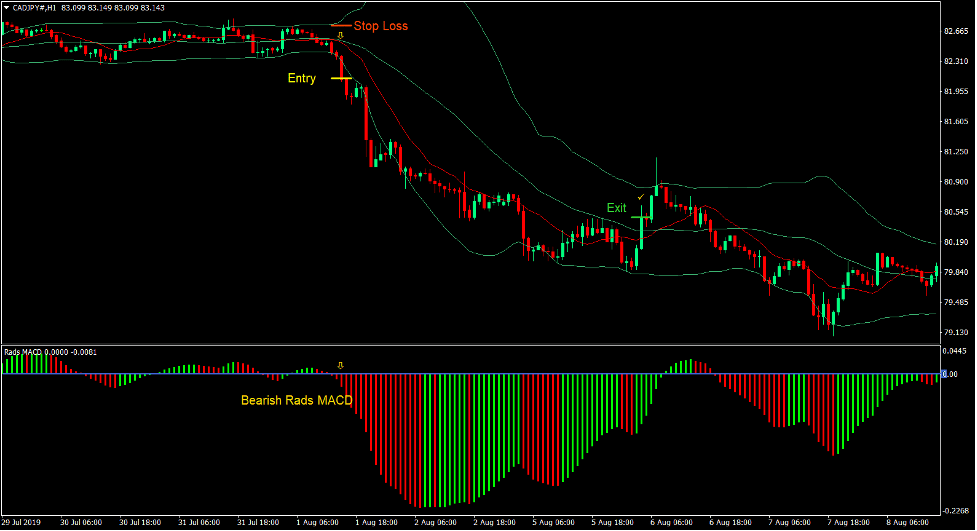
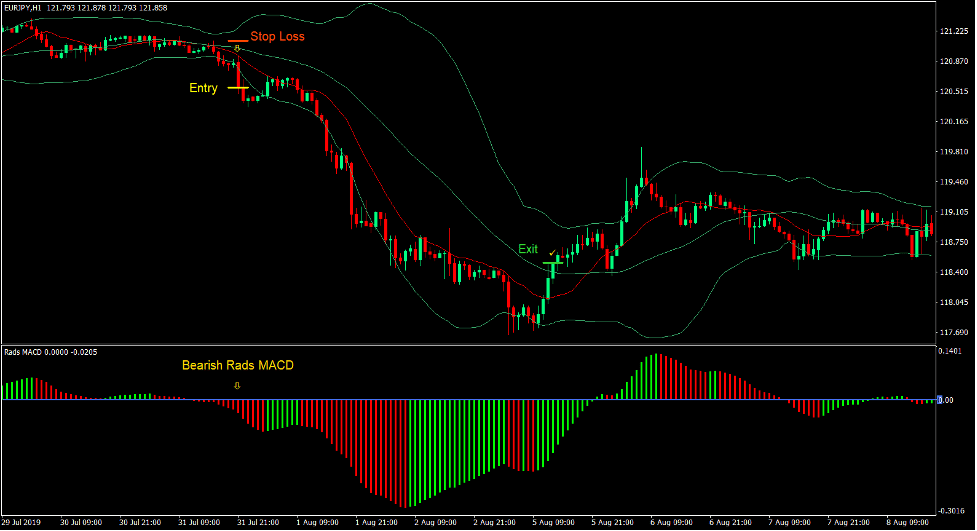
Sell Trade Setup
Entry
- The MUV line should cross below the midline of the Bollinger Bands.
- The Rads MACD histogram bars should cross below zero and should be red.
- A bearish momentum candle should close below the lower Bollinger Bands.
- Enter a sell order on the confirmation of these conditions.
Stop Loss
- Set the stop loss on the resistance above the entry candle.
Exit
- Close the trade as soon as price closes above the midline of the Bollinger Bands.
Conclusion
This trading strategy is a working trading strategy. Many traders use the crossover of two moving average lines to identify a trend reversal. Many traders also use the closing of a momentum candle outside of the Bollinger Bands to identify a momentum trade setup. Combining these two together allows for a trade setup which is based both on a crossover and a momentum trade setup. The result is a trade setup with an improve win probability.
Recommended MT4 Brokers
XM Broker
- Free $50 To Start Trading Instantly! (Withdraw-able Profit)
- Deposit Bonus up to $5,000
- Unlimited Loyalty Program
- Award Winning Forex Broker
- Additional Exclusive Bonuses Throughout The Year

>> Sign Up for XM Broker Account here <<
FBS Broker
- Trade 100 Bonus: Free $100 to kickstart your trading journey!
- 100% Deposit Bonus: Double your deposit up to $10,000 and trade with enhanced capital.
- Leverage up to 1:3000: Maximizing potential profits with one of the highest leverage options available.
- ‘Best Customer Service Broker Asia’ Award: Recognized excellence in customer support and service.
- Seasonal Promotions: Enjoy a variety of exclusive bonuses and promotional offers all year round.

>> Sign Up for FBS Broker Account here <<
Click here below to download: