


Introduction to the Pivot Point Indicator
Support and Resistance levels often work when the bulk of the market consider it as such. However, traders would often identify support and resistance levels manually, making it very subjective.
Using the Pivot Point indicator is an effective way to objectively identify support and resistance levels which many seasoned traders are most likely looking at.
What is the Pivot Point Indicator?
The Pivot Point indicator is a widely used technical indicator used to determine the general trend direction or bias based on the relationship of price action in relation to historical price data points.
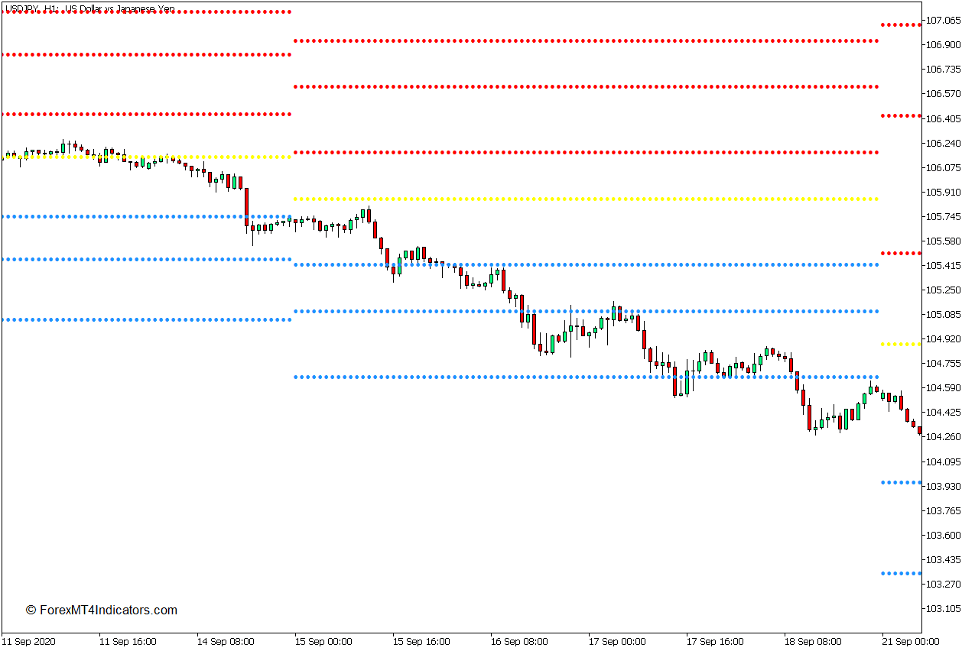
Pivot Point indicators generally plot seven lines. The main line would be the Pivot Point (PP) line which would be the basis for the other lines. Pivot Point indicators then plot three Resistance lines (R1, R2, and R3) above the Pivot Point line, and three Support lines (S1, S2, and S3) below the Pivot Point line.
This version of the Pivot Point indicator plots a dotted yellow line to represent the Pivot Point (PP) line, three dotted red lines to represent the Resistance lines (R1, R2, and R3), and three dotted blue lines to represent the Support lines (S1, S2, and S3).
How the Pivot Point Indicator Works?
Although there are several methods in computing for the Pivot Point lines, the middle line of the Pivot Point line is usually a basic computation. It is usually the average of the high, low, and close of the prior period. For example, a Daily Pivot Point would be the average of the high, low, and close of the previous day, while a Weekly Pivot Point would be the average of the high, low, and close of the previous week.
The Support (S1, S2, and S3) and Resistance (R1, R2, and R3) lines have different formulas all of which are also derived from the main Pivot Point (PP) line.
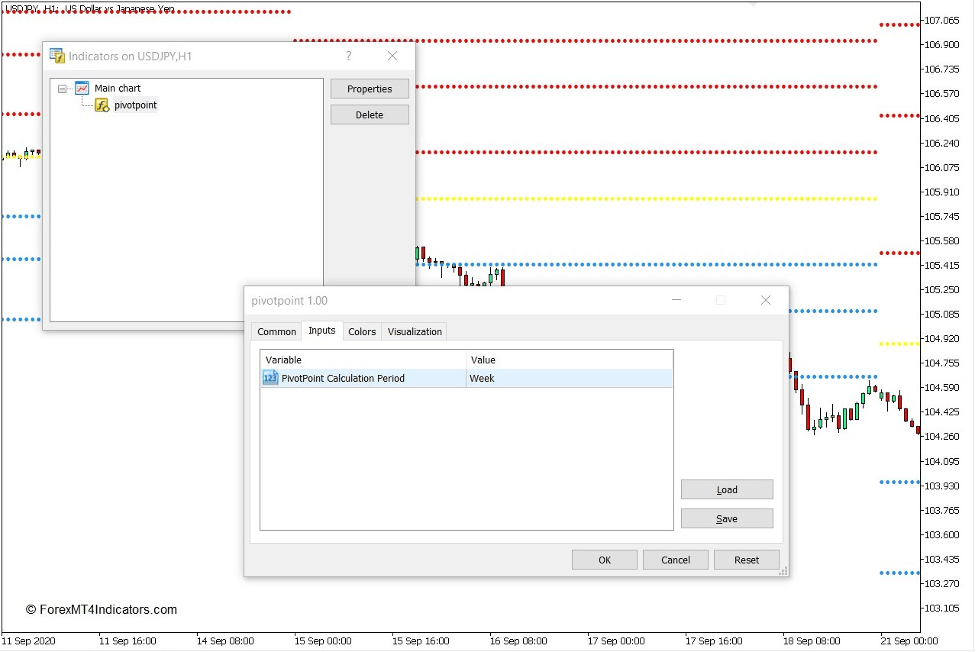
This version of the Pivot Point indicator allows traders to choose whether the indicator should plot the Daily, Weekly, or Monthly Pivot Points. This variable can be modified under the Inputs tab of the indicator’s settings.
How to use the Pivot Point Indicator for MT5
The main Pivot Point (PP) line can be used to determine the general trend direction or bias based on where price is in relation to it. The trend bias can be bullish if price is above the PP line, and bearish if price is below the PP line.
The Pivot Point lines including the support and resistances should be used as a regular support or resistance line is used. It can be used as a basis where price can reverse. Support or Resistances can also act as the opposite once broken.
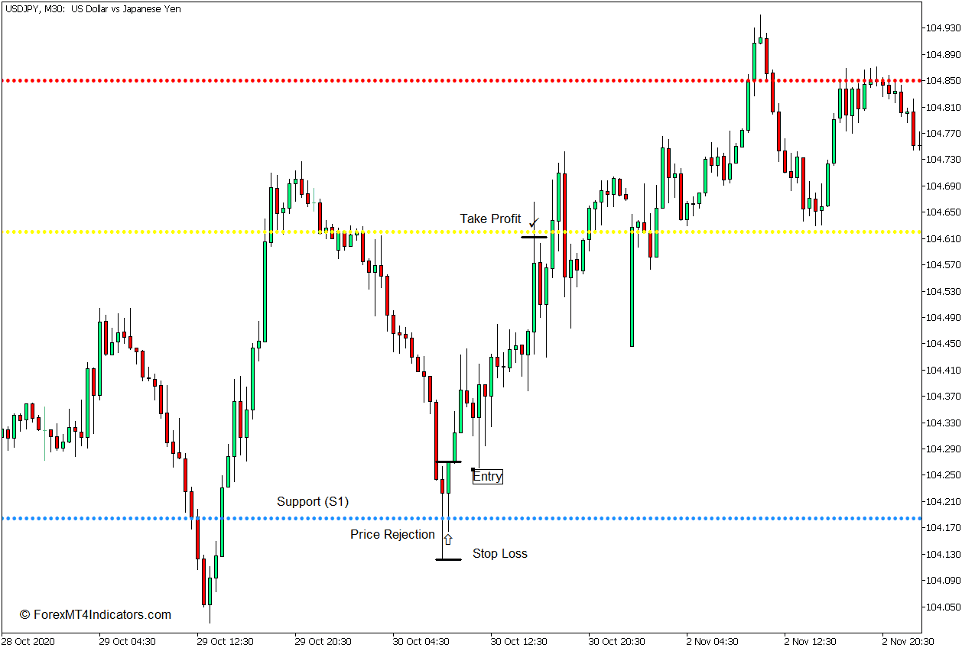
Buy Trade Setup
When to Enter?
Open a buy order as soon as price action shows signs of price rejection on a Support line. Set the stop loss below the bullish reversal pattern.
When to Exit?
Set the take profit target on the next Pivot Point or Resistance level.
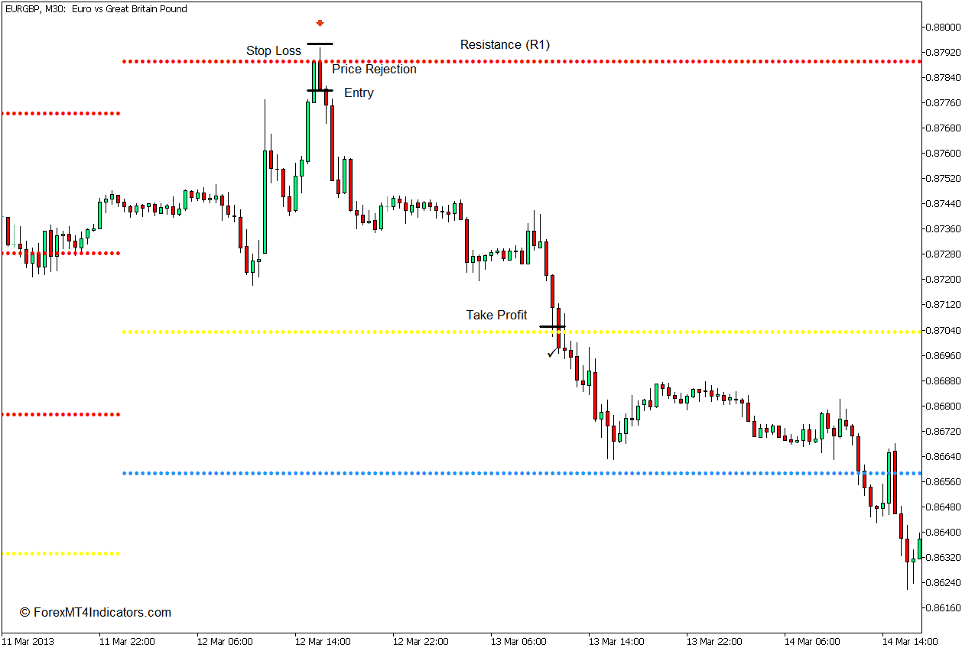
Sell Trade Setup
When to Enter?
Open a sell order as soon as price action shows signs of price rejection on a Resistance line. Set the stop loss above the bearish reversal pattern.
When to Exit?
Set the take profit target on the next Pivot Point or Support level.
Conclusion
The Pivot Point indicator is a very useful technical indicator for identifying potential areas where price can reverse.
Recommended MT5 Brokers
XM Broker
- Free $50 To Start Trading Instantly! (Withdraw-able Profit)
- Deposit Bonus up to $5,000
- Unlimited Loyalty Program
- Award Winning Forex Broker
- Additional Exclusive Bonuses Throughout The Year

>> Sign Up for XM Broker Account here <<
FBS Broker
- Trade 100 Bonus: Free $100 to kickstart your trading journey!
- 100% Deposit Bonus: Double your deposit up to $10,000 and trade with enhanced capital.
- Leverage up to 1:3000: Maximizing potential profits with one of the highest leverage options available.
- ‘Best Customer Service Broker Asia’ Award: Recognized excellence in customer support and service.
- Seasonal Promotions: Enjoy a variety of exclusive bonuses and promotional offers all year round.

>> Sign Up for FBS Broker Account here <<

(Free MT5 Indicators Download)
Click here below to download: