


Introduction to the MACD Histogram Indicator
Trend following and momentum-based technical indicators are very useful for technical traders because it simplifies how traders can identify trend-based trading opportunities.
The MACD Histogram is one of the most popular types of trend following technical indicators that traders use. Let us take a look at how we can use this indicator.
What is the MACD Histogram Indicator?
MACD Histogram is a version of the classic MACD indicator or Moving Average Convergence and Divergence.
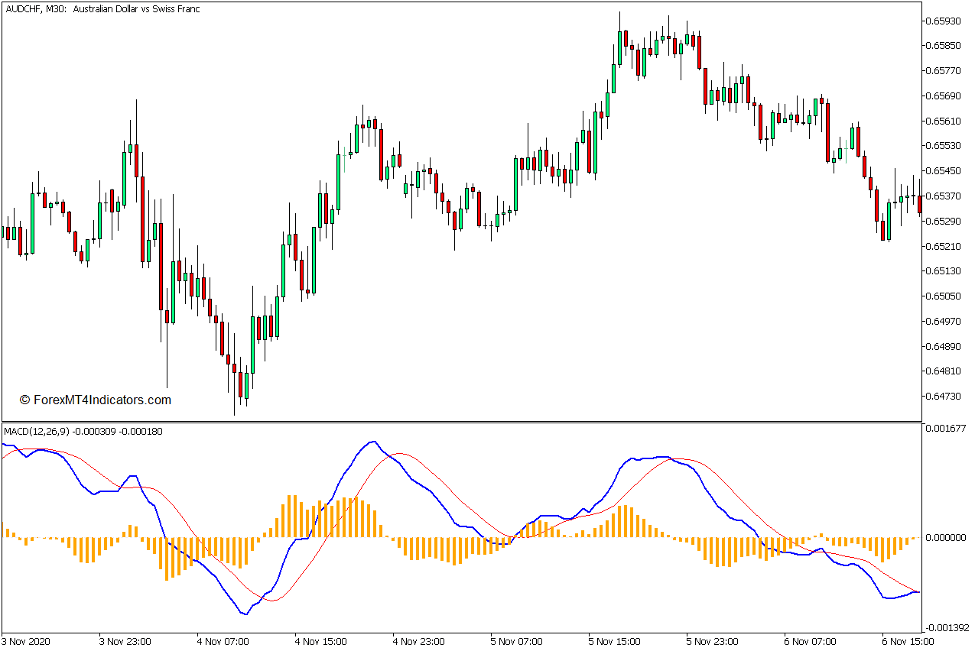
The MACD Histogram indicator is a momentum-based technical indicator which presents trend and momentum direction and reversals as an oscillator. It plots two lines, one moving faster than the other. These two lines oscillate unbound around a midline which is zero. It also plots histogram bars which are also based on the two lines.
How the MACD Histogram Indicator Works?
The MACD Histogram indicator is based on an underlying pair of Exponential Moving Average (EMA) lines. It computes for the difference between the faster moving average line and the slower moving average line. The difference is then plotted on its indicator window as the MACD line, which is the faster line.
It then averages out the MACD line using a Simple Moving Average (SMA) method. This is then plotted as the signal line, which is the slower line.
The histogram bars are basically the difference between the MACD line and the signal line.
How to use the MACD Histogram Indicator for MT5
Trend direction can be based on whether the two lines are generally positive or negative. Short-term trends can also be identified based on how the two lines interact. A bullish trend reversal is indicated whenever the faster line crosses above the slower line, while a bearish trend reversal is indicated whenever the faster line crosses below the slower line.
The same can also be applied with the histogram bars. A bullish trend reversal is indicated whenever the histogram bars crosses above zero, and a negative trend reversal is indicated whenever the bars cross below zero.
Being an oscillator type of indicator, the MACD Histogram can also be effectively used for identifying divergences. This is usually based on the MACD line.
The MACD Histogram indicator has four variables that can be modified.
“Fast EMA period” and “Slow EMA period” refers to the number of periods which the underlying EMA lines are based on.
“Signal SMA period” refers to the number of periods which the signal line is based on.
“Applied price” refers to the price point source on each candle.

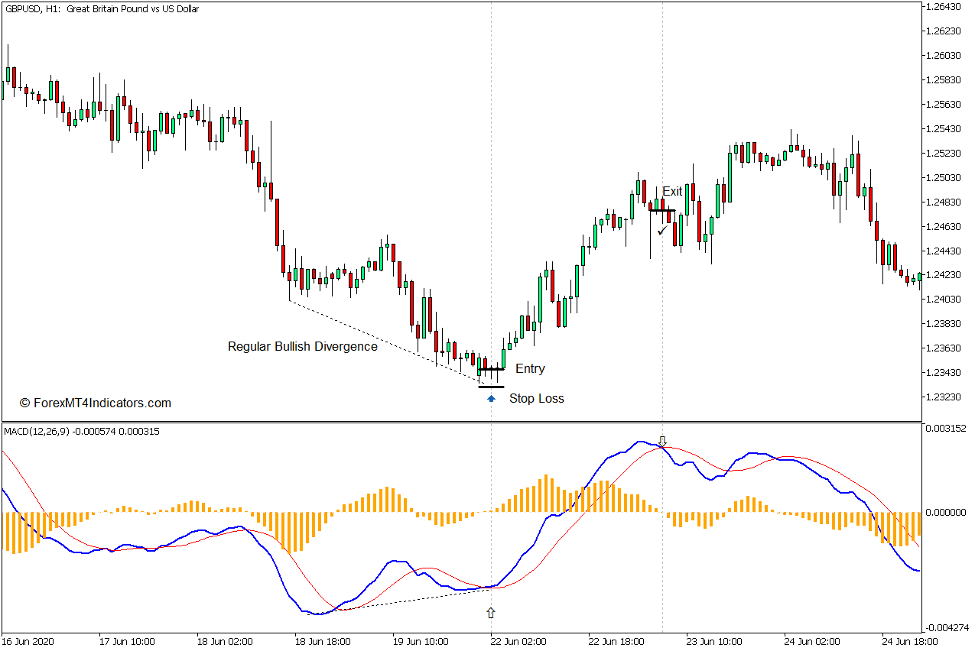
Buy Trade Setup
When to Enter?
Observe a bullish divergence using the MACD Histogram. Open a buy order as soon as the MACD line crosses above the signal line. Set the stop loss on the support below the entry candle.
When to Exit?
Close the trade as soon as the MACD line crosses below the signal line.
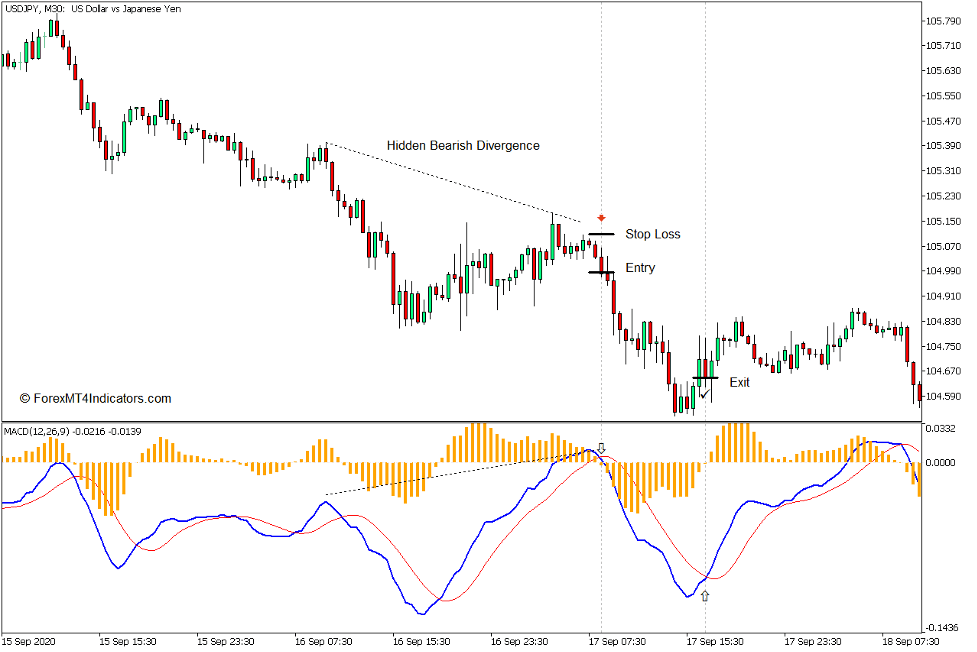
Sell Trade Setup
When to Enter?
Observe a bullish divergence using the MACD Histogram. Open a buy order as soon as the MACD line crosses above the signal line. Set the stop loss on the support below the entry candle.
When to Exit?
Close the trade as soon as the MACD line crosses below the signal line.
Conclusion
The MACD Histogram is a very useable technical indicator which many traders can benefit from. You can easily add this indicator as an arsenal within your trading system.
Recommended MT5 Brokers
XM Broker
- Free $50 To Start Trading Instantly! (Withdraw-able Profit)
- Deposit Bonus up to $5,000
- Unlimited Loyalty Program
- Award Winning Forex Broker
- Additional Exclusive Bonuses Throughout The Year

>> Sign Up for XM Broker Account here <<
FBS Broker
- Trade 100 Bonus: Free $100 to kickstart your trading journey!
- 100% Deposit Bonus: Double your deposit up to $10,000 and trade with enhanced capital.
- Leverage up to 1:3000: Maximizing potential profits with one of the highest leverage options available.
- ‘Best Customer Service Broker Asia’ Award: Recognized excellence in customer support and service.
- Seasonal Promotions: Enjoy a variety of exclusive bonuses and promotional offers all year round.

>> Sign Up for FBS Broker Account here <<

(Free MT5 Indicators Download)
Click here below to download: