


Trend following strategies are probably one of the easiest types of strategies to implement. It is rule based, easy to understand, and with the right type of market, could work well for many traders.
There are many different types of trend following strategies. There are the moving average crossover strategies, some would use naked chart price action and some trendlines, while others would use technical indicators.
Of those mentioned, the use of technical indicators is probably one of the easiest ways to do trend following. This is because technical indicators make it easy for traders to follow rules and removes much of the guess work from the process.
The MACD Fx Line Forex Trading Strategy is a custom technical indicator-based trend following strategy. This allows traders to follow and implement a trading strategy that works well on the forex markets.
Moving Average Convergence and Divergence
The Moving Average Convergence and Divergence or MACD is a widely used technical indicator. Even with its simplicity, many professional traders who have been using it have made money using MACD based strategies and technical analysis.
The MACD is an oscillating indicator which is based on three moving averages. The first two moving averages are Exponential Moving Averages (EMA) and has one EMA is faster than the other. The slower EMA is then subtracted from the faster EMA. The difference of the two is then plotted on the MACD’s chart, usually as a histogram. Then, another moving average is used as a signal line. This is usually a Simple Moving Average (SMA).
There are many ways to trade the MACD. One way is to use the crossing over of the either the signal line or the histogram on the midline. If using the histogram cross on the midline, the strategy would still technically be a crossover strategy since it is based on the difference of two moving averages.
Another way to trade it is by trading the crossing over of the histogram and the signal line. Buy signals are generated when the histograms cross above the signal line and sell signals if it is the inverse.
The midline could also be used as a trade filter. This is because price typically goes back to the mean, the MACD would also usually go back to the midline. This is popular among mean reversion type of traders.
Then, there are those who use the MACD as a basis for divergences. These are the disagreements between the peaks and troughs of an oscillating indicator and the price action.
FX Line Indicator
The Fx Line Indicator is a custom indicator based on a modified moving average. This technical indicator paints a moving average line on the price chart, which changes color every time the line changes slope direction. If the line is sloping up, it is painted blue. If the line is sloping down, it is painted white.
This is based on the idea that one of the ways to determine trend direction using a moving average line is based on the direction of its slope. Moving averages are considered bullish whenever it is sloping up, and bearish whenever it is sloping down. The steeper the slope, the stronger the trend. Flatter slopes on the other hand are common on choppy markets.
Trading Strategy Concept
The MACD Fx Line Forex Trading Strategy produces trading signals based on the convergence of the MACD histogram crossover of the midline and the Fx Line’s slope direction.
Individually, these technical indicators, although not perfect, could produce trades that results in high yielding trade setups. When combined together, the setups tend to have a better win rate, while improving further the yields of profitable trades. This is because trades are exited before the market fully reverses. This prevents traders from giving up much of the profit back to the market.
Indicators:
- ForexLine_update_03
- MACD
Timeframe: 1-hour, 4-hour and daily charts
Currency Pair: major and minor pairs
Trading Session: Tokyo, London and New York sessions
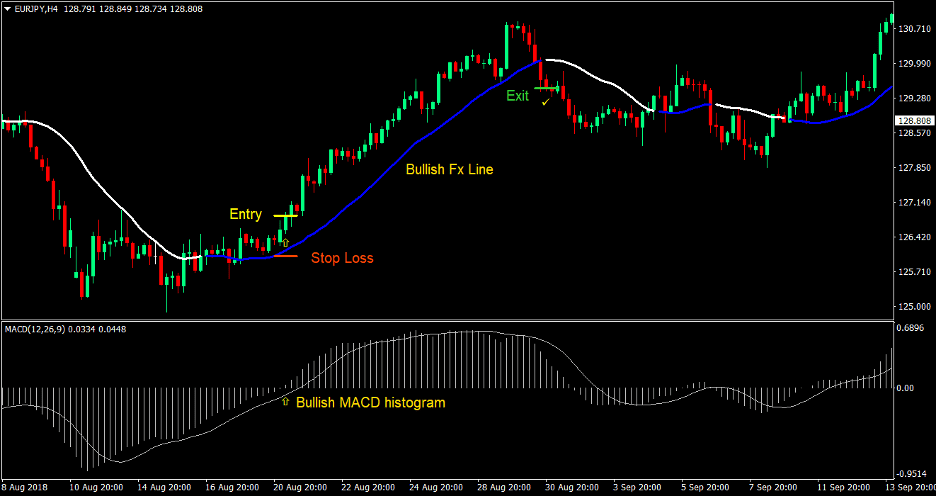
Buy (Long) Trade Setup
Entry
- The Fx Line Indicator should be painting a blue moving average indicating a bullish market bias
- Enter a buy order as soon as the MACD histogram crosses above the midline indicating a bullish signal
Stop Loss
- Set the stop loss at the support level below the entry candle
Exit
- Close the trade as soon as the Fx Line Indicator changes to white indicating a probable bearish trend reversal
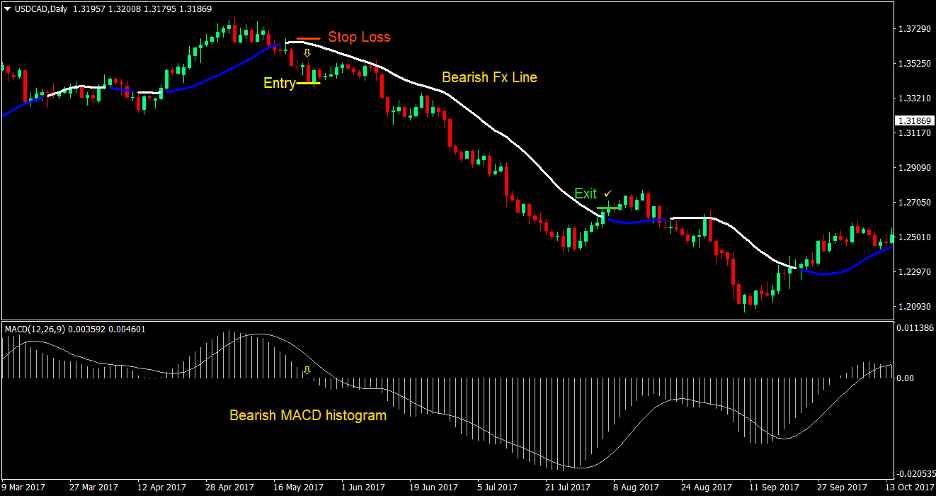
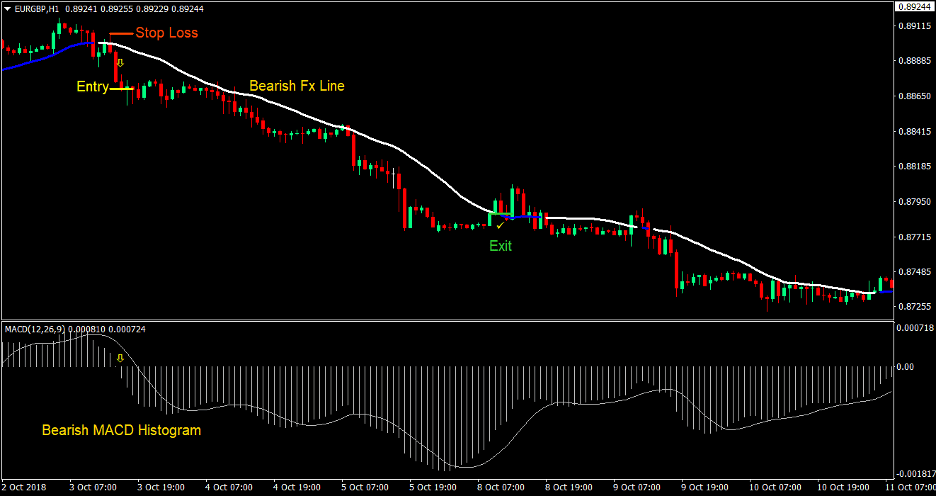
Sell (Short) Trade Setup
Entry
- The Fx Line Indicator should be painting a white moving average indicating a bearish market bias
- Enter a sell order as soon as the MACD histogram crosses below the midline indicating a bearish signal
Stop Loss
- Set the stop loss at the resistance level above the entry candle
Exit
- Close the trade as soon as the Fx Line Indicator changes to blue indicating a probable bullish trend reversal
Conclusion
The MACD Fx Line Forex Trading Strategy is an excellent trend following strategy, which allows traders to objectively identify entry points based on the markets trend direction. This trading strategy would usually result to high return trade setups, which could profit returns on the risk of 3:1 or more.
There are cases however when the market doesn’t trend long enough and would reverse too soon. This is common on range bound and choppy market conditions. Avoid using this strategy on such conditions. Instead, implement this strategy on markets and pairs which have a strong tendency to trend.
Recommended MT4 Brokers
XM Broker
- Free $50 To Start Trading Instantly! (Withdraw-able Profit)
- Deposit Bonus up to $5,000
- Unlimited Loyalty Program
- Award Winning Forex Broker
- Additional Exclusive Bonuses Throughout The Year

>> Sign Up for XM Broker Account here <<
FBS Broker
- Trade 100 Bonus: Free $100 to kickstart your trading journey!
- 100% Deposit Bonus: Double your deposit up to $10,000 and trade with enhanced capital.
- Leverage up to 1:3000: Maximizing potential profits with one of the highest leverage options available.
- ‘Best Customer Service Broker Asia’ Award: Recognized excellence in customer support and service.
- Seasonal Promotions: Enjoy a variety of exclusive bonuses and promotional offers all year round.

>> Sign Up for FBS Broker Account here <<
Click here below to download: