


Ichimoku Kinko Hyo (or simply Ichimoku) is a powerful technical analysis tool used by traders to assess market trends, identify support and resistance levels, and generate buy or sell signals. Developed by Japanese journalist Goichi Hosoda in the late 1960s, Ichimoku combines several components to provide a holistic view of price action.
Why Is It Important?
Understanding market dynamics is crucial for successful trading. The Ichimoku Kinko Hyo indicator offers a comprehensive perspective, considering multiple time intervals and price points. By doing so, it helps traders make informed decisions based on a broader context rather than relying solely on short-term data.
How Does It Work?
The Ichimoku Kinko Hyo consists of five key components:
- Tenkan-sen (Conversion Line): Represents the average price over a short time interval.
- Kijun-sen (Base Line): Reflects the average price over a longer time interval.
- Senkou Span A (Leading Span A): Calculated as the midpoint between Tenkan-sen and Kijun-sen, shifted forward.
- Senkou Span B (Leading Span B): Represents the average price over an extended time interval, also shifted forward.
- Chikou Span (Lagging Span): Displays the closing price of the current candle, shifted backward.
How To Understand?
When the Chikou Span crosses the price chart from bottom to top, it signals a potential buy opportunity. Conversely, a top-to-bottom Chikou Span crossover suggests a potential sell opportunity. Kijun-sen acts as a market movement indicator. Prices above it indicate a likely uptrend, while crossing below may signal a trend change. Tenkan-sen’s slope indicates the overall trend direction.
What Are Trading Strategies While Using This Indicator?
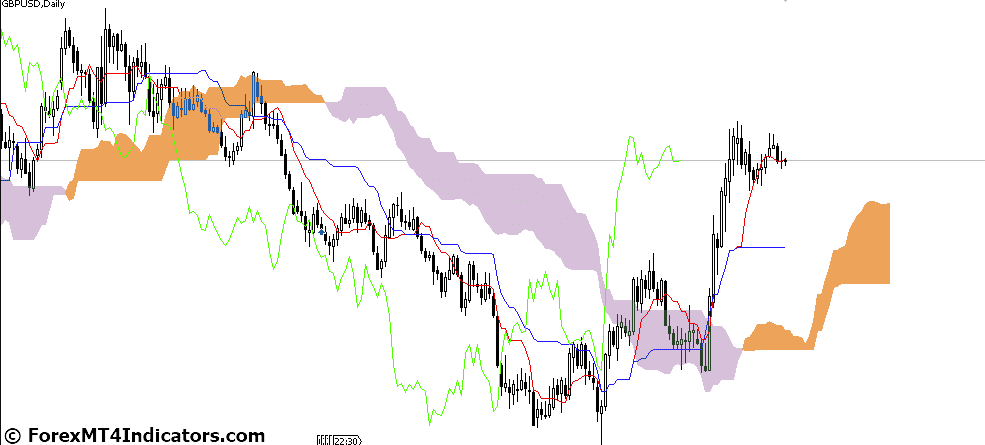
- Cloud Trading: The area between Senkou Span A and Senkou Span B forms the “cloud.” Price within the cloud suggests a non-trending market, while above or below indicates potential support or resistance levels.
- Kijun-sen Signals: Tenkan-sen crossing Kijun-sen provides buy/sell signals.
- Trend Confirmation: Monitor the slope of Tenkan-sen and Kijun-sen for trend confirmation.
How to Trade with Ichimoku Kinko Hyo Indicator
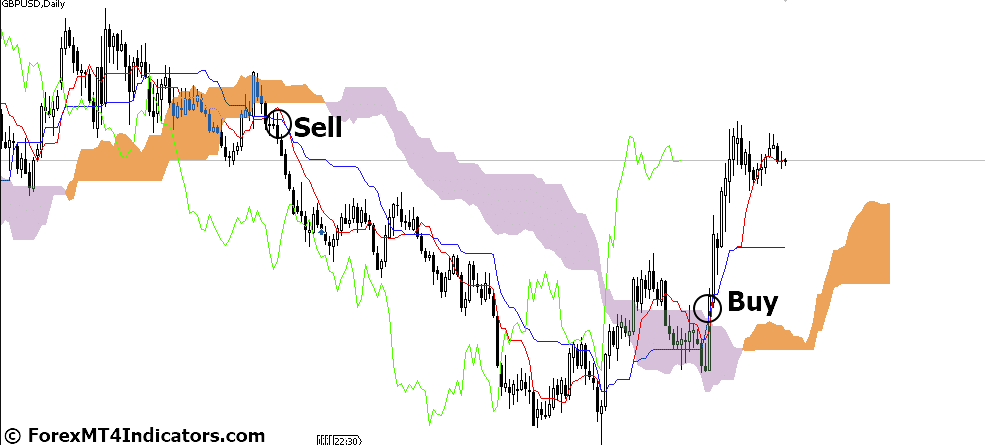
Buy Entry
- Wait for a Chikou Span bottom-to-top crossover.
- Confirm with price action showing signs of reversal.
- Consider entering a long position.
Sell Entry
- Look for a Chikou Span top-to-bottom crossover.
- Observe price rejection at resistance levels.
- Consider shorting the market.
Conclusion
The Ichimoku Kinko Hyo indicator is a versatile tool that combines various elements to provide a holistic view of market conditions. Traders can use it to identify trends, support/resistance levels, and potential entry/exit points. While mastering Ichimoku may take time, its insights can significantly enhance your trading strategy.
Recommended MT5 Brokers
XM Broker
- Free $50 To Start Trading Instantly! (Withdraw-able Profit)
- Deposit Bonus up to $5,000
- Unlimited Loyalty Program
- Award Winning Forex Broker
- Additional Exclusive Bonuses Throughout The Year

>> Sign Up for XM Broker Account here <<
FBS Broker
- Trade 100 Bonus: Free $100 to kickstart your trading journey!
- 100% Deposit Bonus: Double your deposit up to $10,000 and trade with enhanced capital.
- Leverage up to 1:3000: Maximizing potential profits with one of the highest leverage options available.
- ‘Best Customer Service Broker Asia’ Award: Recognized excellence in customer support and service.
- Seasonal Promotions: Enjoy a variety of exclusive bonuses and promotional offers all year round.

>> Sign Up for FBS Broker Account here <<

(Free MT5 Indicators Download)
Click here below to download: