


Market reversals are excellent trading opportunities where traders can make profits from the market. Many traders may find it risky especially because traders are often trading against an established trend. However, with the right trading probabilities, market reversal strategies can provide an excellent market edge which traders can use to profit from the market.
The strategy discussed below is an example of a reversal trading strategy which provides a systematic trade setup based on divergences.
i-Spectr Analysis OsMA Indicator
The i-Spectr Analysis OsMA Indicator is a custom technical indicator which is based on the Oscillator of Moving Averages (OsMA) Indicator.
As its name suggests, the classic OsMA Indicator is an oscillator which is derived from a moving average of another oscillator type of indicator. The most commonly used underlying oscillator for an OsMA Indicator is the Moving Average Convergence and Divergence (MACD).
The OsMA Indicator has an algorithm which calculates for the moving average of the underlying oscillator values. It then calculates for the difference between the underlying oscillator value and its moving average. The resulting difference is then used to plot the oscillator histogram bars or oscillator line.
OsMA = Oscillator Value – Moving Average Value of the Underlying Oscillator
The i-Spectr Analysis OsMA Indicator also uses an underlying MACD to calculate for its OsMA bars. It also modifies its calculations by using the Exponential Moving Average (EMA) all throughout its calculations. Users may also modify the parameter variables of the underlying MACD within the indicator’s settings. One unique feature of the OsMA Indicator is that it also has a smoothing factor. This allows the indicator to plot oscillations which are much smoother compared to other OsMA Indicators.
This OsMA Indicator plots histogram bars to present its oscillations. It also has a feature wherein the color of the bars changes depending on the direction of the oscillations. Positive bars with increasing values are colored blue, while positive bars with decreasing value are colored green. Negative bars with decreasing values are colored magenta, while negative bars with increasing values are colored purple. This feature allows users to easily identify potential momentum reversals, as well as the weakening or strengthening of the trend.

Divergences and Reversals
In trading and technical analysis charting, Divergences are basically scenarios wherein there are deviations between the direction or trajectory of price action when compared to an indicator, particularly and oscillator type of indicator.
Although price charts may often seem erratic without any clear direction, technical traders who have observed price charts quite enough know that price typically oscillates up and down the price range in a wave like manner. These wave like structures are formed because of the impulses that the market makes as it moves up and down, creating peaks and dips which are called swing highs and swing lows. This characteristic is what many traders refer to as price action.
Oscillators typically mimic the movements of price action. This is why the oscillations of price action are often aligned with the oscillations of a technical indicator. It also follows that oscillators would typically mimic the trajectory of price action. If price action is making higher swing highs and swing lows, its corresponding oscillator would usually do the same. Inversely, if price action is making lower swing highs and swing lows, then the same oscillator should also follow the same trajectory.
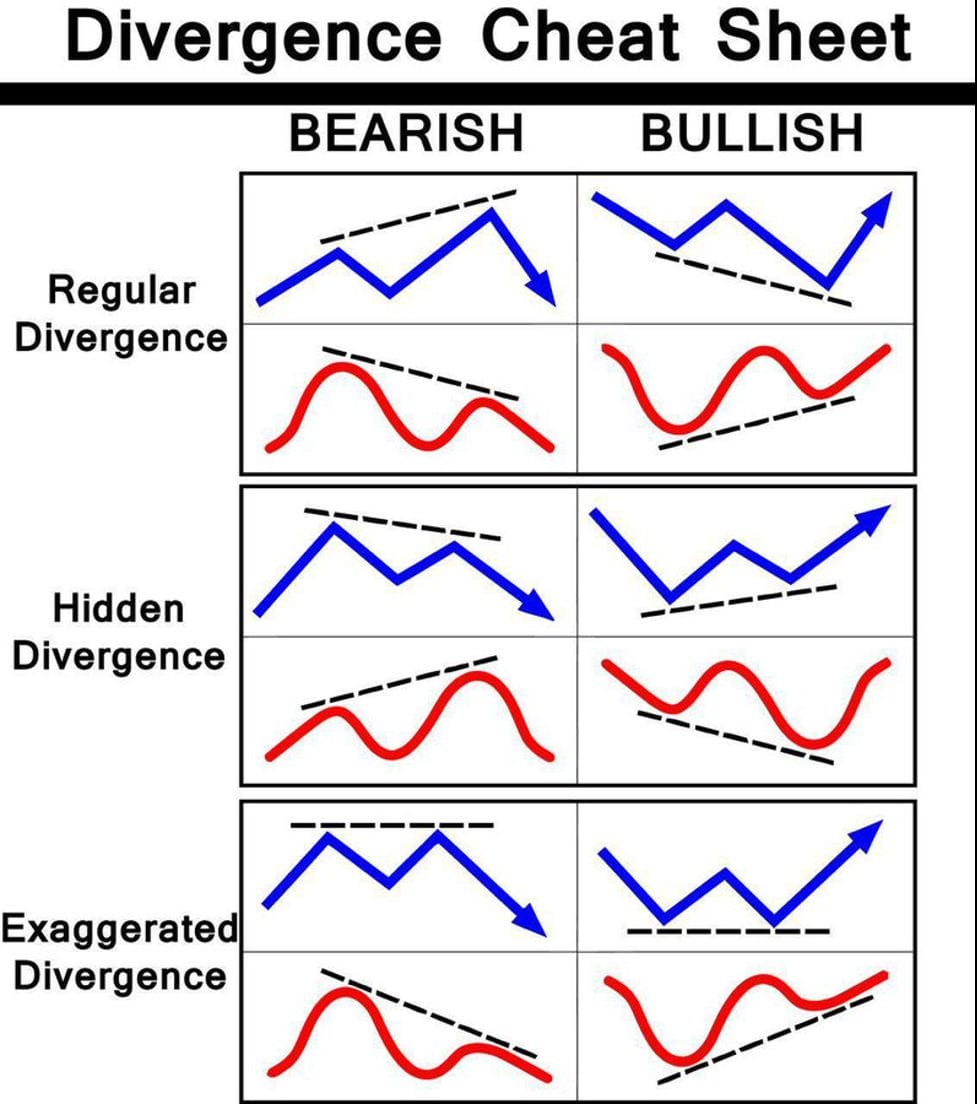
However, there are situations wherein the trajectory of the swing highs and swing lows of price action would differ from that of its corresponding oscillator. Price action may be making higher swing lows, while an oscillator is making lower dips or vice versa. It could also be that price action is making lower swing highs, while its corresponding oscillator is making higher swing highs or vice versa. These scenarios are called Divergences. Such market scenarios are telltale signs of a possible market reversal which traders may act upon.
The chart below shows the different types of divergences which traders may use.
Trading Strategy Concept
i-Spectr Analysis OsMA Divergence Forex Trading Strategy for MT5 is a simple momentum reversal trading strategy which uses Divergences as its basis for identifying possible market reversals. It uses the i-Spectr Analysis OsMA Indicator as a basis for identifying possible divergences when compared with the corresponding price action of the tradeable instrument it represents.
Traders may use the color change of the bars to identify the peaks and bottoms of the i-Spectr Analysis OsMA oscillations and compare it with the oscillations of price action for easier reference.
As soon as a valid divergence is identified, traders may use the same color change on the second peak or bottom of the oscillator bars as a confirmation of the momentum reversal.
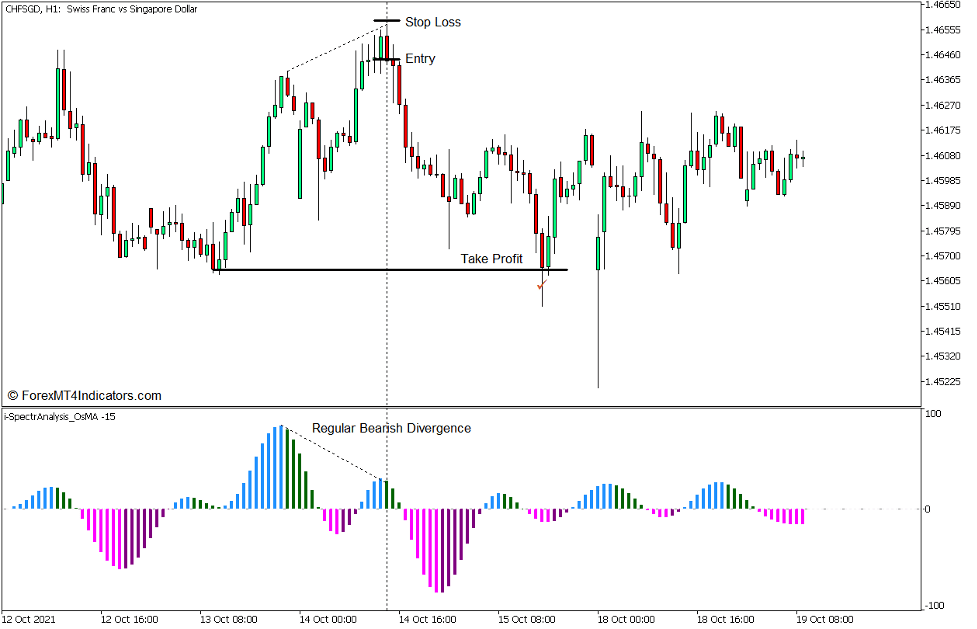
Buy Trade Setup
Entry
- Identify a valid bullish divergence by comparing the swing lows of price action with the dips on the i-Spectr Analysis OsMA bars.
- A bullish trade signal may be confirmed as soon as the color of the i-Spectr Analysis OsMA bars change to purple on the second dip of the oscillator.
Stop Loss
- Set the stop loss below the entry candle.
Exit
- Set the take profit target on the level of the next swing high area above the trade entry.

Sell Trade Setup
Entry
- Identify a valid bearish divergence by comparing the swing highs of price action with the peaks on the i-Spectr Analysis OsMA bars.
- A bearish trade signal may be confirmed as soon as the color of the i-Spectr Analysis OsMA bars change to green on the second peak of the oscillator.
Stop Loss
- Set the stop loss above the entry candle.
Exit
- Set the take profit target on the level of the next swing low area below the trade entry.
Conclusion
Divergences are some of the most effective reversal trade signals that traders may use. Many professional traders who use divergences would say that it often results in a win probability of 1 out of 3 trades. That may not seem much but with the right risk-reward ratio, this win percentage would be very profitable. The question is which oscillator should traders use.
The i-Spectr Analysis OsMA Indicator discussed above seems to be effective in identifying valid divergences. However, it should also be paired with sound market structure analysis and a good grasp of price action. Doing so may improve your trade signals especially when used in the right market scenario.
Recommended MT5 Brokers
XM Broker
- Free $50 To Start Trading Instantly! (Withdraw-able Profit)
- Deposit Bonus up to $5,000
- Unlimited Loyalty Program
- Award Winning Forex Broker
- Additional Exclusive Bonuses Throughout The Year

>> Sign Up for XM Broker Account here <<
FBS Broker
- Trade 100 Bonus: Free $100 to kickstart your trading journey!
- 100% Deposit Bonus: Double your deposit up to $10,000 and trade with enhanced capital.
- Leverage up to 1:3000: Maximizing potential profits with one of the highest leverage options available.
- ‘Best Customer Service Broker Asia’ Award: Recognized excellence in customer support and service.
- Seasonal Promotions: Enjoy a variety of exclusive bonuses and promotional offers all year round.

>> Sign Up for FBS Broker Account here <<
Click here below to download: