


Non-traders look at a chart differently compared to seasoned traders. Often, when a person sees a price chart for the first time, they would often see a meaningless movement of bars going up and down. Some people who have an idea what price charts are would understand that it is price moving up and down. Still, they would find it to be erratic and very unpredictable. Seasoned traders however see opportunities. They could see where price is generally moving and where price might potentially bounce or reverse.
Trading is a speculation game. No one knows for sure where price is moving and where price might reverse. However, it is also a probabilities game. Traders who have an idea how price behaves have a clue where price may “potentially” bounce. Traders who can look at a chart and see where price might potentially reverse and are willing to risk capital and allow statistics to play into their favor are the ones who can make money over the long run.
Knowing that trading is a speculation game and a probabilities game. Traders would have to accept the fact that they would have to make an educated guess regarding where price would reverse. The question now is where could price potentially reverse.
FX Fish 200 EMA Bounce Forex Trading Strategy is a strategy that provides setups where price can potentially bounce or reverse. It makes use of the 200 Exponential Moving Average (EMA) plus a couple of highly reliable technical indicators to help traders identify high probability trade setups.
FX Fish Indicator
FX Fish is a trend following technical indicator which is a part of the oscillator family of indicators. It is computed by converting historical price movements into a Gaussian normal distribution. This allows the indicator to highlight points when price is on an extreme level compared to the recent price movements. This in turn allows traders to identify probable reversal points based on the price chart and the indicator. It also allows traders to identify the direction of the trend as well as the waves within a trend.
Because the FX Fish indicator converts price data which is typically not normally distributed into a Gaussian normal distribution, the FX Fish indicator helps traders see clearly the oscillations of price movements, which otherwise would seem nonsensical.
The FX Fish indicator plots histogram bars that could oscillate to positive or negative. Positive bars indicate a bullish bias and plots lime bars. On the other hand, negative bars indicate a bearish bias and plots red bars. It also has markers at level 0.3 and -0.3. Breaches above 0.3 indicate that price is gaining bullish momentum, while drops below -0.3 indicates that price is gaining bearish momentum.
EMA Crossover Signal
One of the most popular ways traders identify a reversal is using moving averages. Traders would simply plot two moving averages on the price chart with one moving average moving slower compared to the other. These moving averages would crossover each other whenever the trend direction reverses. Traders would use these crossovers as a trend reversal entry signal.
EMA Crossover Signal is a technical indicator which provides trend reversal entry signals based on the crossing over of two Exponential Moving Averages (EMA). It clears up the chart because it removes the moving average lines and plots arrows pointing the direction of the trend reversal instead. This makes it a lot easier for the trader to identify possible trend reversal points.
Trading Strategy
This trading strategy trades on bounces off the area of the Exponential Moving Average (EMA) line.
First, traders should identify the long-term trend bias based on the location of price action in relation to the 200 EMA line. The 200 EMA line should also slope in the direction of the trend.
As soon as we confirm the trend direction, we could then wait for price to retrace towards the area near the 200 EMA line. Price should then bounce off it.
As price bounces off the 200 EMA line, both the FX Fish and the EMA Crossover Signal indicators should confirm the short-term momentum direction. The confluence of these signals would serve as a confirmation of a valid trade setup and an entry signal.
Indicators:
- 200 EMA
- FX_Fish
- Period: 20
- EMA Crossover Signal
- Faster EMA: 5
- Slower EMA: 20
Preferred Time Frames: 1-hour, 4-hour and daily charts
Currency Pairs: FX majors, minors and crosses
Trading Sessions: Tokyo, London and New York sessions
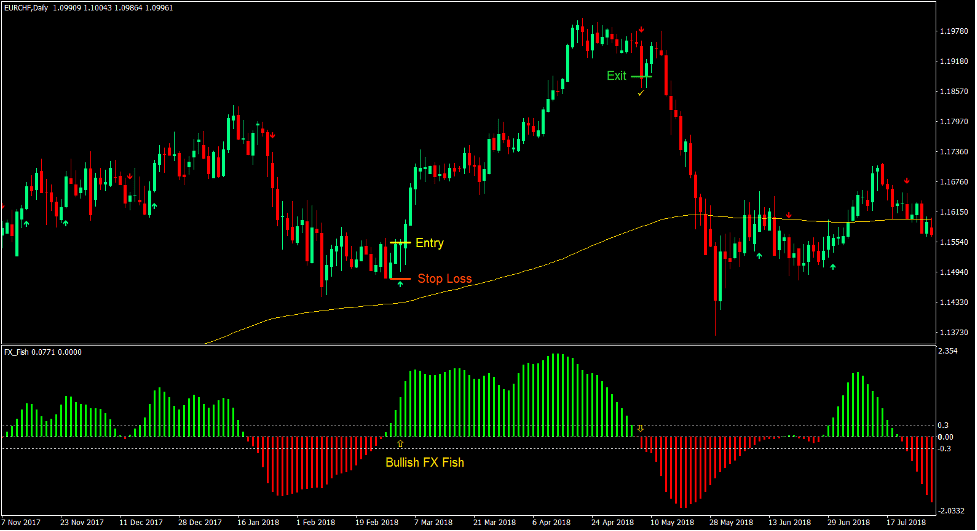
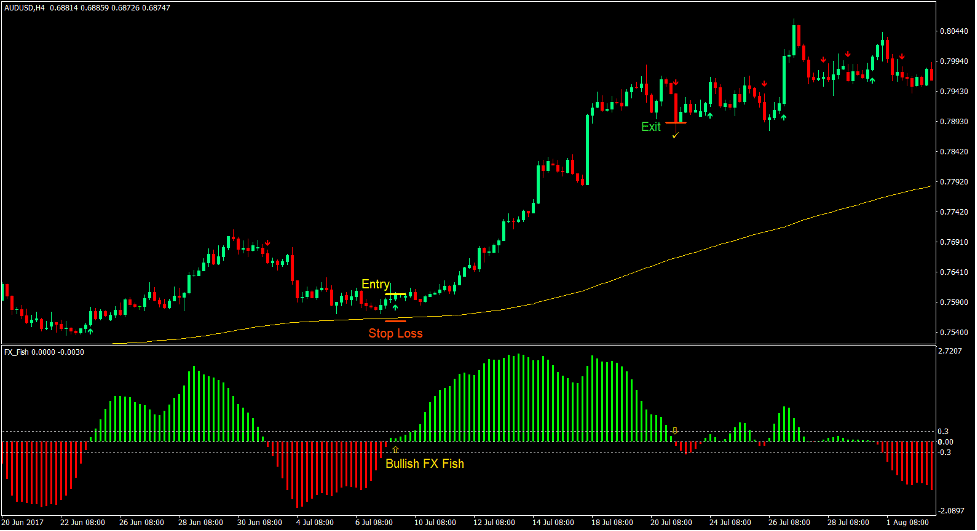
Buy Trade Setup
Entry
- Price action should be above the 200 EMA line.
- The 200 EMA line should slope up.
- Price action should retrace towards the 200 EMA line.
- The FX Fish bars should be positive.
- The EMA Crossover Signal indicator should plot an arrow pointing up.
- Enter a buy order on the confirmation of these conditions.
Stop Loss
- Set the stop loss on the support below the entry candle.
Exit
- Close the trade as soon as the FX Fish bars become negative.
- Close the trade as soon as the EMA Crossover Signal indicator plots an arrow pointing down.
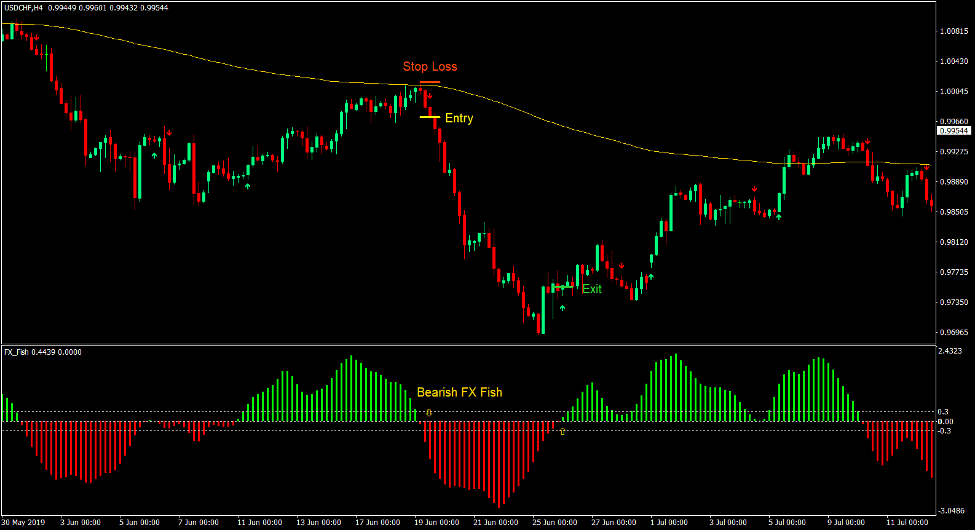
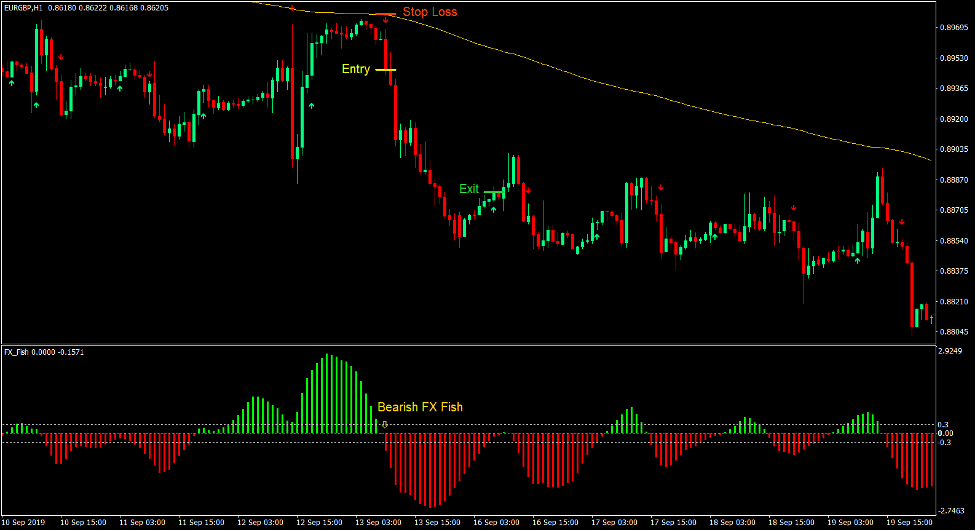
Sell Trade Setup
Entry
- Price action should be below the 200 EMA line.
- The 200 EMA line should slope down.
- Price action should retrace towards the 200 EMA line.
- The FX Fish bars should be negative.
- The EMA Crossover Signal indicator should plot an arrow pointing down.
- Enter a sell order on the confirmation of these conditions.
Stop Loss
- Set the stop loss on the resistance above the entry candle.
Exit
- Close the trade as soon as the FX Fish bars become positive.
- Close the trade as soon as the EMA Crossover Signal indicator plots an arrow pointing up.
Conclusion
This trading strategy is a working trading strategy that should produce high probability trade setups.
Many traders use the bounce of price action from the 200 EMA line as a basis for a trade setup. Some would plot a diagonal support or resistance line and use the breakout of price action as confirmation of a trade setup. However, there are also instances wherein price action would aggressively retrace towards the 200 EMA line only to bounce off it.
The addition of the FX Fish and the EMA Crossover Signal indicators only serves as a confirmation of the trade setup to help filter out low probability trades and time the entry more effectively.
Recommended MT4 Brokers
XM Broker
- Free $50 To Start Trading Instantly! (Withdraw-able Profit)
- Deposit Bonus up to $5,000
- Unlimited Loyalty Program
- Award Winning Forex Broker
- Additional Exclusive Bonuses Throughout The Year

>> Sign Up for XM Broker Account here <<
FBS Broker
- Trade 100 Bonus: Free $100 to kickstart your trading journey!
- 100% Deposit Bonus: Double your deposit up to $10,000 and trade with enhanced capital.
- Leverage up to 1:3000: Maximizing potential profits with one of the highest leverage options available.
- ‘Best Customer Service Broker Asia’ Award: Recognized excellence in customer support and service.
- Seasonal Promotions: Enjoy a variety of exclusive bonuses and promotional offers all year round.

>> Sign Up for FBS Broker Account here <<
Click here below to download: