


If you have been into trading for quite some time, you would know how erratic the market is. The forex market is even more notorious for being too volatile. Price could move up and down for more than hundred pips in a matter of a few hours at times. Being the biggest market, with over $5.1 trillion being traded on average daily, the forex market could naturally be the most volatile trading market. At the same time, it also holds the most potential for traders to make profit. With volatility comes not only risks but also opportunities.
The question now is how do we make sense out of the forex market’s volatility? How can we anticipate and read where the market is more likely to move?
There are no quick and sure answers to the question above. Trading is a speculation game. Traders would never no for sure where price is moving. All they can do is speculate based on the historical movement patterns of the market.
One pattern or movement characteristic that is widely popular is the Elliott Wave. The Elliott Wave Theory is a form of technical analysis wherein traders would forecast price movements based on a recurring movement cycle or pattern.
Seasoned Elliott Wave traders can effectively spot such waves. However, new traders might find it difficult to read the cyclical patterns of the forex market due to its volatility. Elliott Wave Forex Swing Trading Strategy simplifies the process using an indicator which is based on the Elliott Wave theory.
Elliott Wave Oscillator
The Elliott Wave Oscillator (EWO) is a trend following technical indicator which is part of the oscillator family of indicators.
It is basically an oscillator which is computed based on the difference between a 5-period Simple Moving Average (SMA) and a 35-period Simple Moving Average (SMA). It also uses the standard close of each period as a basis for the computation. The results are then plotted as histogram bars on its own indicator window.
This version of the EWO computes the histogram bars based on the median price. It also applies a smoothing method based on a simple moving average. It also plots a moving average of the histogram bars, which is preset to plot a 5-period Simple Moving Average (SMA). However, these settings can be modified according to the preference of the trader.
In a way, this version of the EWO is much like the Moving Average Convergence and Divergence (MACD) and can be used the same way.
The crossover of the bars and the line would indicate an initial signal of a probable trend reversal. The crossing over of the bars and the midline, which is zero, would confirm the trend reversal. Traders can use these signals as a reversal signal. The location of the bars in relation to the midline could also serve as a trend direction filter.
Relative Strength Index
Relative Strength Index (RSI) is a classic technical indicator which is also an oscillator.
The RSI compares the bullish price momentum, which is the average gain, against the bearish price momentum, which is the average loss. It also incorporates the previous average gain and loss with the current gain and loss. The resulting figures are plotted as a line which oscillates within the range of 0 to 100, with 50 being the midline. This line would usually mimic the movement of price action on the price chart.
The classic RSI indicator window typically has markers at 30, 50 and 70. If the line is below 30, price is considered oversold and might be due for a bullish reversal. If the line is above 70, price is considered overbought and might be due for a bearish reversal. However, momentum traders look at it differently. They would consider a drop below 30 as a possible bearish momentum and a breach above 70 as a possible bullish momentum. Level 50, being the midpoint would usually be used as a basis for trend bias or trend direction.
Many trend and momentum following traders would also add levels 45 and 55 to identify the trend. A breach above 55 would indicate a confirmation of a bullish trend while level 45 would serve as support. On the other hand, a drop below level 45 would indicate a bearish trend while level 55 would serve as a resistance.
EMA 5 10 34 Crossover
EMA 5 10 34 Crossover is a trend reversal signal indicator which is based on the crossing over three moving average lines.
This indicator is preset to produce a signal whenever the 5-period, 10-period and 34-period Exponential Moving Average (EMA) lines crossover. However, these parameters can be modified depending on what the trader prefers or needs.
The indicator plots a red arrow pointing down whenever it detects a bearish trend reversal signal and a blue arrow pointing up whenever it detects a bullish trend reversal signal.
Trading Strategy
This trading strategy is a simple trend reversal trading strategy which is based on the confluence of signals coming from the three indicators above.
First, we would look for the EWO bars to cross over its midline. The trade direction will be based on which direction the bars are crossing.
Then, the RSI line should start to cross above 55 in a bullish trend or below 45 in a bearish trend.
The final entry signal will be based on the signal arrow produced by the EMA 5 10 34 Crossover indicator. However, the underlying EMA lines would be modified in order to fit the type of reversal strategy we are going for.
Indicators:
- EMA 5 10 34 Crossoverl
- Faster MA: 10
- Medium MA: 15
- Slower MA: 36
- Elliott_Wave_Oscillator
- Relative Strength Index
- Period: 20
Preferred Time Frames: 1-hour, 4-hour and daily charts
Currency Pairs: FX majors, minors and crosses
Trading Sessions: Tokyo, London and New York sessions
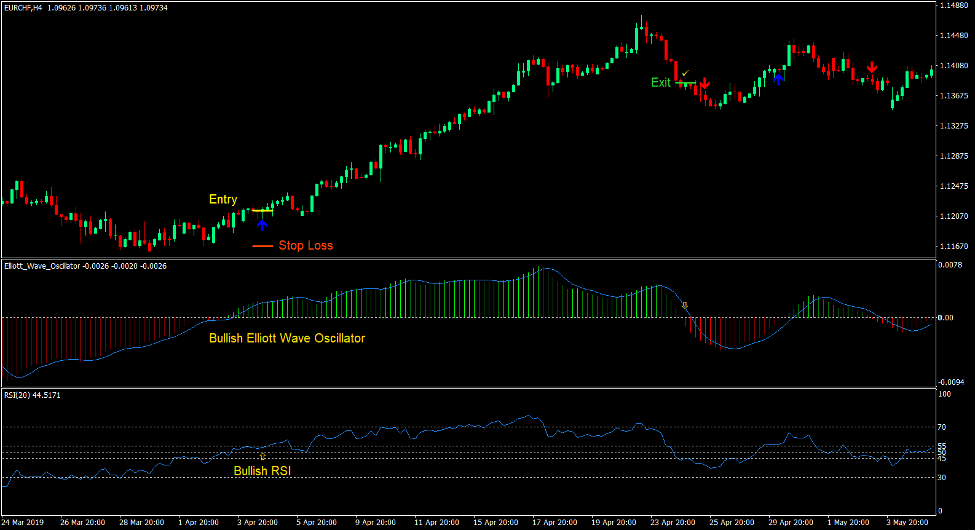
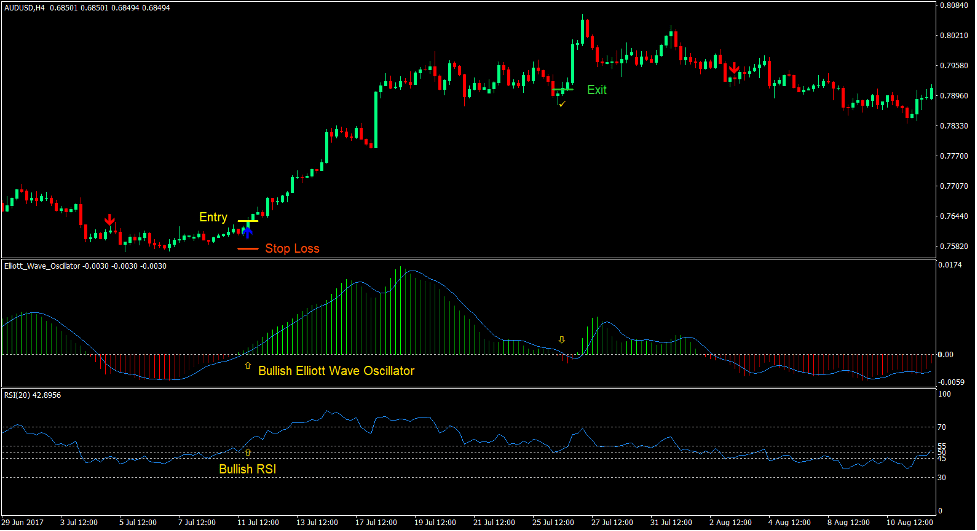
Buy Trade Setup
Entry
- The EWO bars should be positive.
- The RSI line should cross above 55.
- The EMA 5 10 34 Crossover indicator should print an arrow pointing up.
- Enter a buy order on the confluence of these conditions.
Stop Loss
- Set the stop loss on the support level below the entry candle.
Exit
- Close the trade as soon as the EWO bars cross below zero.
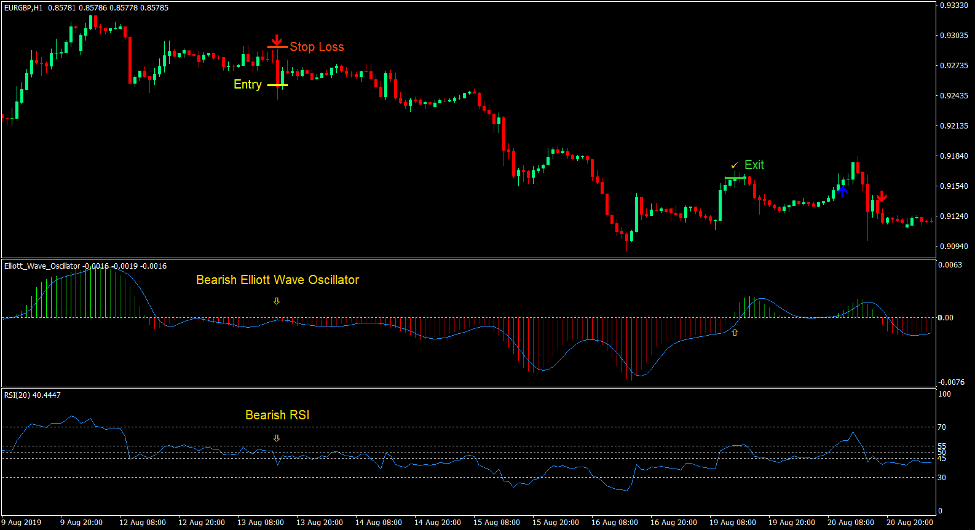
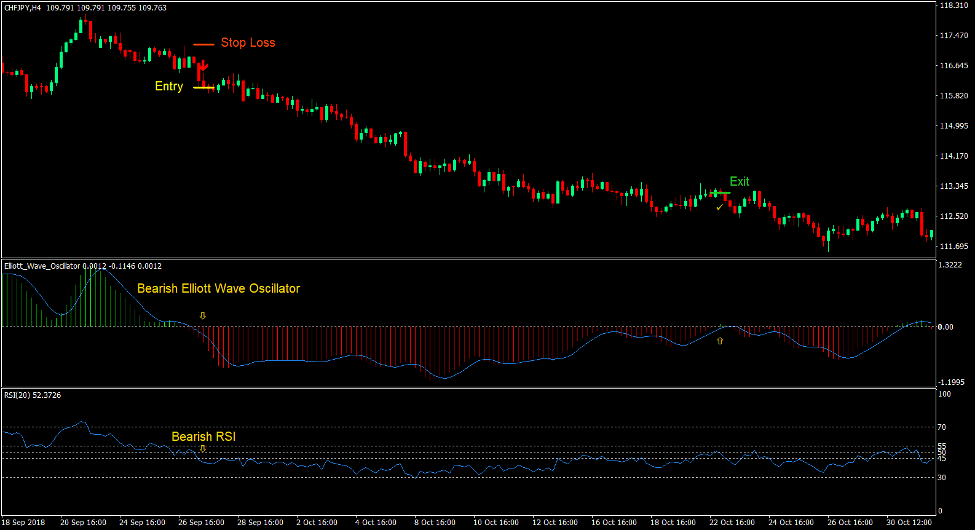
Sell Trade Setup
Entry
- The EWO bars should be negative.
- The RSI line should cross below 45.
- The EMA 5 10 34 Crossover indicator should print an arrow pointing down.
- Enter a sell order on the confluence of these conditions.
Stop Loss
- Set the stop loss on the resistance level above the entry candle.
Exit
- Close the trade as soon as the EWO bars cross above zero.
Conclusion
Trading trend reversals based on a swing trading perspective is an excellent way to trade the market. It is in the swing trading timeframes where market noise is greatly reduced, thus allowing technical analysis to playout in the long run.
The combination of these indicators with these settings are very synergistic. This allows this strategy to produce good trade setups whenever the market is showing signs of a reversal.
Traders should also incorporate supply and demand zones in order for them to have a basis why the market is reversing on certain areas. Traders who can incorporate price action as well as supply and demand or market flow into strategies like this could earn consistent profits from the market.
Recommended MT4 Brokers
XM Broker
- Free $50 To Start Trading Instantly! (Withdraw-able Profit)
- Deposit Bonus up to $5,000
- Unlimited Loyalty Program
- Award Winning Forex Broker
- Additional Exclusive Bonuses Throughout The Year

>> Sign Up for XM Broker Account here <<
FBS Broker
- Trade 100 Bonus: Free $100 to kickstart your trading journey!
- 100% Deposit Bonus: Double your deposit up to $10,000 and trade with enhanced capital.
- Leverage up to 1:3000: Maximizing potential profits with one of the highest leverage options available.
- ‘Best Customer Service Broker Asia’ Award: Recognized excellence in customer support and service.
- Seasonal Promotions: Enjoy a variety of exclusive bonuses and promotional offers all year round.

>> Sign Up for FBS Broker Account here <<
Click here below to download: