


Market trends are often identified based on a consistently rising or dropping swing high or swing low. Price action traders identify uptrends based on rising swing highs and downtrends based on dropping swing lows. Although this method can be very effective, newer traders may struggle to objectively identify trend direction based on swing highs and swing lows. The strategy discussed below uses an indicator which objectively identifies trend direction based higher highs and lower lows.
Aroon Indicator
The Aroon Indicator is a momentum technical indicator which was developed by Tusar Chande in 1995. This indicator was created to help traders identify trend direction and changes, as well as the corresponding strength of the trend.
Traders often identify trends based on price action forming its highs and lows. Uptrend markets are identified based on price action that is consistently creating higher swing highs and swing lows. On the other hand, downtrends are identified based on price action consistently forming lower swing lows and swing highs. The manner in which the Aroon Indicator detects trend direction is closely related to this concept.
The Aroon Indicator does not measure the distance of price vertically based on pips or points. Instead it measures the distance between the highs and lows of price horizontally based on time which is counted based on the number of bars.
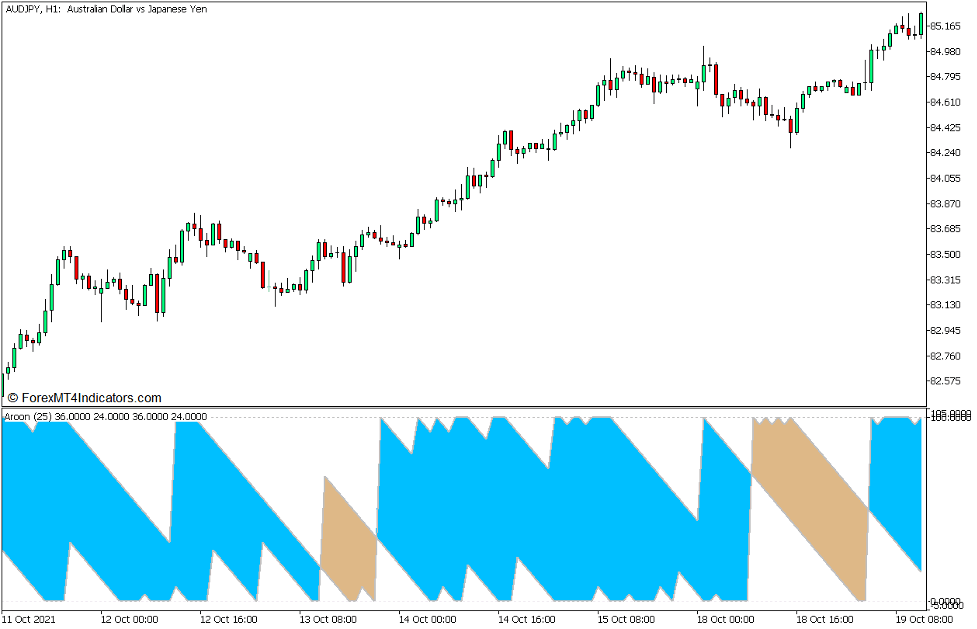
The Aroon Indicator plots two lines, which are the Aroon Up and Aroon Down lines. The Aroon Up line plots its point at 100 whenever it detects a new 25-bar high. The line then drops consistently until it detects a new high, in which case it would spike back up to 100. The line drops to zero if there is no new high detected within the 25-bar window. The same process is also applied with the Aroon Down line, but instead of plotting its line at 100 on a new high, it plots its line at 100 on a new low. To do this, the Aroon Indicator uses the formulas below to calculate for the points on its line.
Aroon Up = [(25 – Periods Since 25-period High) / 25] * 100
Aroon Down = [(25 – Periods Since 25-period Low) / 25] * 100
This creates two lines which crosses over whenever the market is reversing from a scenario wherein it is consistently making new highs, to scenario wherein it is starting to make new lows or vice versa. Such crossovers can be interpreted as a trend reversal.
The indicator simplifies the process of identifying such trend reversals by shading the area between the two lines. It shades the area sky blue to indicate an uptrend, and brown to indicate a downtrend.
Ichimoku Kinko Hyo – Kumo
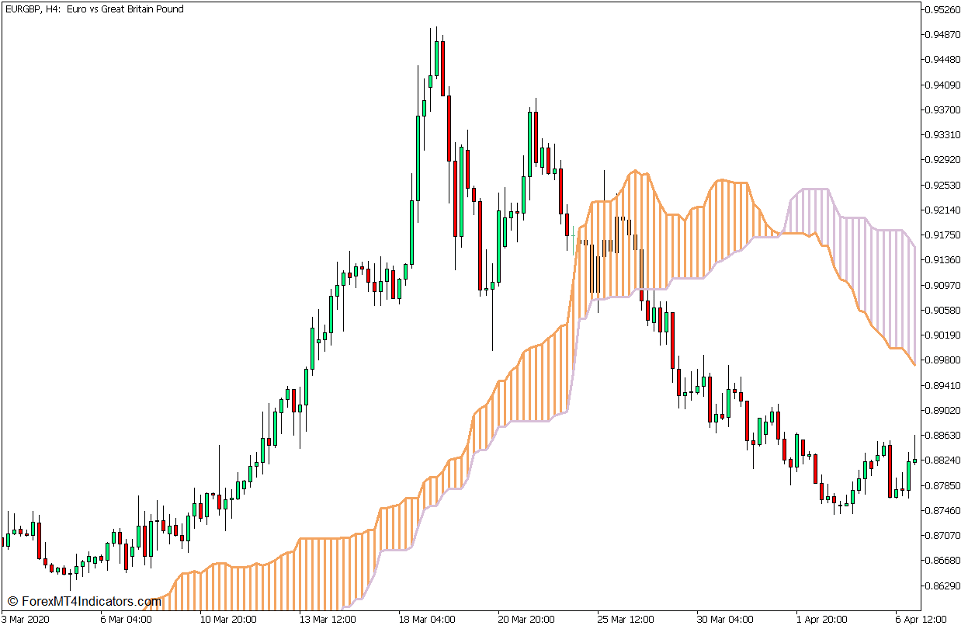
The Kumo, which means “cloud”, is a component of the Ichimoku Kinko Hyo technical indicator system. It is the component of the system which is used to detect the long-term trend direction.
The Kumo is composed of the Leading Span A (Senkou Span A) and Leading Span B (Senkou Span B) lines. The Leading Span A line is the average of the Ichimoku Kinko Hyo’s Conversion Line, which is the median of price within a 9-bar window, and Base Line, which is the median of price within a 26-bar window. On the other hand, the Leading Span B line it the median of price within 52-bar window. It uses the formulas below to plot the Senkou Span A and Senkou Span B lines.
Conversion Line = (9-period High + 9-period Low) / 2
Base Line = (26-period High + 26-period Low) / 2
Leading Span A = (Conversion Line + Base Line) / 2
Leading Span B = (52-period High + 52-period Low) / 2
The Kumo is shaded brown whenever the Leading Span A line is above the Leading Span B line, indicating an uptrend. Inversely, it is shaded thistle whenever the Leading Span A line is below the Leading Span B line.
Trading Strategy Concept
Aroon Up and Down Trend Following Forex Trading Strategy is a trend following trading strategy which uses the confluence between the long-term trend and the short-term trend to identify and detect possible high probability trend following trade setups.
The Kumo component of the strategy is used to help traders identify the long-term trend direction. This is based on the color of the shaded area between the two lines. Trade direction is isolated only in the direction of the trend as indicated by the Kumo.
Once the trade direction is confirmed, trade signals are identified whenever the Aroon Up and Aroon Down lines crossover indicating a trend reversal signal which is in confluence with the long-term trend direction as indicated by the Kumo.
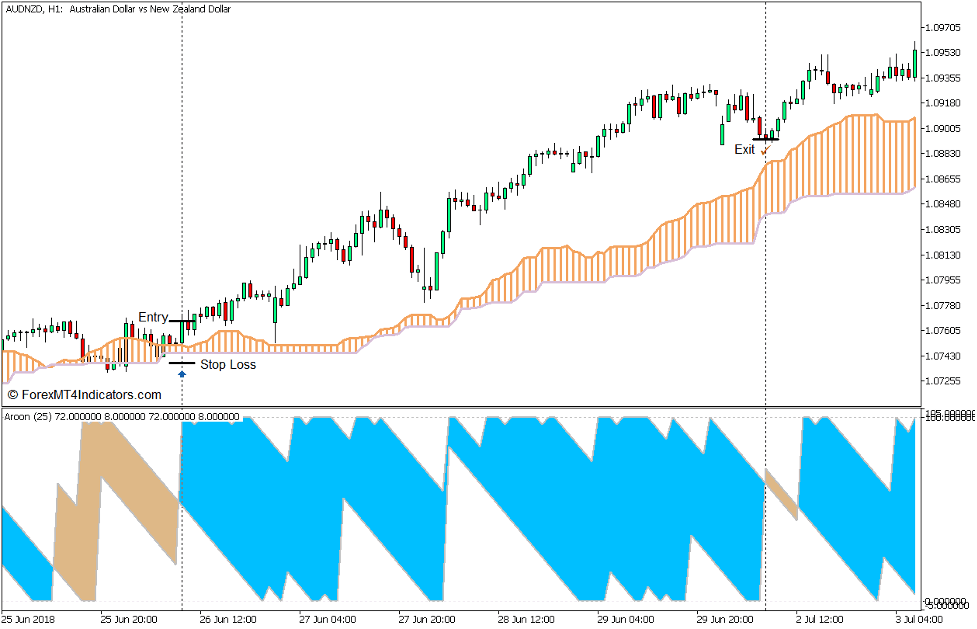
Buy Trade Setup
Entry
- The Kumo should be shaded brown indicating a long-term bullish trending market.
- Open a buy order as soon as the area between the two Aroon lines are shaded sky blue indicating a bullish trend reversal.
Stop Loss
- Set the stop loss below the Kumo.
Exit
- Close the trade as soon as the area between the two Aroon lines changes to brown indicting a potential bearish reversal.
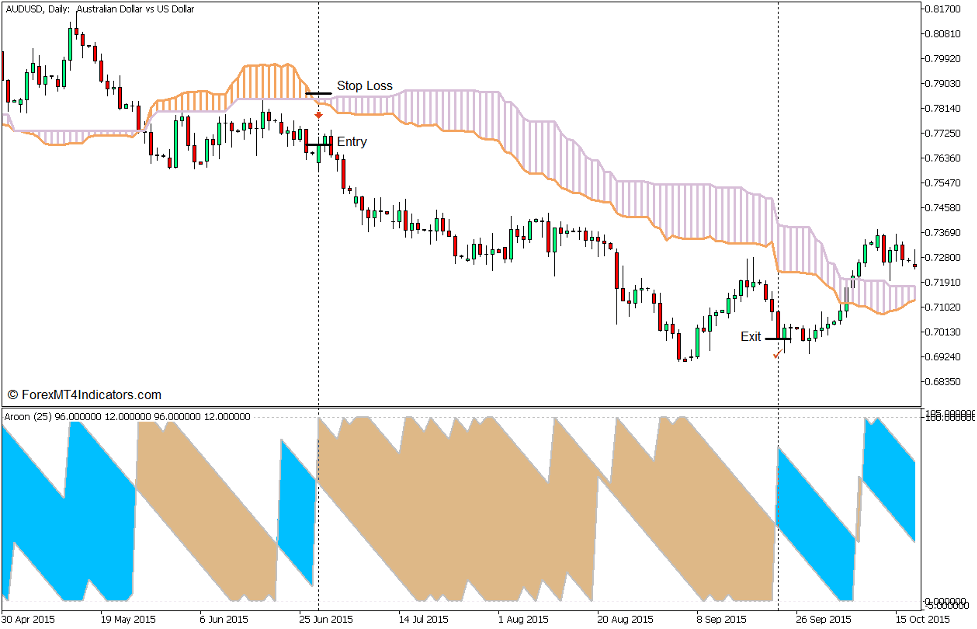
Sell Trade Setup
Entry
- The Kumo should be shaded thistle indicating a long-term bearish trending market.
- Open a sell order as soon as the area between the two Aroon lines are shaded brown indicating a bearish trend reversal.
Stop Loss
- Set the stop loss above the Kumo.
Exit
- Close the trade as soon as the area between the two Aroon lines changes to sky blue indicting a potential bullish reversal.
Conclusion
Trend following strategies can be excellent trading opportunities because it often allows traders to earn huge profits. However, trend following strategies can also be a cause of confusion for some traders because it is not applicable on all market conditions. It is effective on trending markets but is also ineffective in markets that are ranging or markets with no clear trend direction.
The win probability of a trend following strategy can be improved if the trade signals are based on a confluence of the long-term and short-term trend bias. This strategy applies this method by trading only on the confluence of the Kumo and the Aroon Indicator.
Recommended MT5 Brokers
XM Broker
- Free $50 To Start Trading Instantly! (Withdraw-able Profit)
- Deposit Bonus up to $5,000
- Unlimited Loyalty Program
- Award Winning Forex Broker
- Additional Exclusive Bonuses Throughout The Year

>> Sign Up for XM Broker Account here <<
FBS Broker
- Trade 100 Bonus: Free $100 to kickstart your trading journey!
- 100% Deposit Bonus: Double your deposit up to $10,000 and trade with enhanced capital.
- Leverage up to 1:3000: Maximizing potential profits with one of the highest leverage options available.
- ‘Best Customer Service Broker Asia’ Award: Recognized excellence in customer support and service.
- Seasonal Promotions: Enjoy a variety of exclusive bonuses and promotional offers all year round.

>> Sign Up for FBS Broker Account here <<
Click here below to download: