


Trading is a group think endeavor. Contrary to popular belief, traders do not make money by hoping other traders lose. Instead, traders make money by trading in the direction which a bigger chunk of market participants expect price to move. For example, if a bigger chunk of the market believes price would go up, chances are they will start buying the currency, expecting to sell it at a higher price in the future. More traders hitting that buy button means more demand for the currency. More demand means higher prices.
This is why traders tend to group think. Traders would try to anticipate what the market is thinking.
Trading is all about anticipating what price would do at a certain area on the price chart. It is about anticipating what other traders might do once they see such patterns and trade accordingly.
With that said, there are certain areas on the price chart that are of interest to many traders. Often, price movement would see some action and volatility as price touches these levels.
One of these key areas are the popular moving average lines, particularly the 50-period and 200-period moving average line. These moving averages are commonly accepted mid-term and long-term trend indicators.
Some traders expect price to reverse whenever it crosses over these moving average lines. Others expect price to bounce off as it touches the line. This often causes volatility which makes some traders win big and others lose profits. Because traders approach these moving average lines differently, many traders consider trading on these areas as risky. However, there are ways to trade these scenarios quite effectively.
50-50 Momentum Cross Forex Trading Strategy provides an entry setup that allows traders to take trend reversal trades on crossovers of the 50-period Simple Moving Average (SMA) line. It has a relatively higher probability because of the momentum confirmations that it has using momentum indicators.
X Master Formula
X Master Formula is an oscillating indicator that helps traders identify trend direction. It is a simple oscillator that is unbounded and could oscillate in a free range.
The indicator is plotted as a series of dots that oscillate up and down. The dots are colored depending on the direction of its slope. As the slope of the oscillator changes, the color of the dots also changes indicating a shift in the mid-term trend. Lime dots indicate a bullish trend while red dots indicate a bearish trend.
Force Index
The Force Index indicator is an oscillating technical indicator which is mainly used to identify momentum. It analyzes the movement of price as well as the volume behind it to assess the power or momentum behind a price movement.
This indicator is a free-ranging oscillator that could oscillate in the positive or negative territory. Positive figures indicate a bullish bias while negative figures indicate a bearish bias. The Force Index line also spikes up whenever a strong bullish momentum occurs, and spikes down whenever a strong bearish momentum occurs.
Aside from assessing momentum, the Force Index indicator could also be used to identify possible reversal points. It could be used to identify divergences which are prime indications of a possible reversal.
Trading Strategy
This trading strategy is a basic trend reversal strategy using the crossover of price and the 50 SMA line. Although price could tend to bounce off the 50 SMA line, having price crossover with strong momentum is a good indication of a trend reversal. The key is identifying crossovers with strong momentum.
This strategy helps traders identify crossovers with strong momentum by looking for a confluence of momentum and trend reversal using the two indicators.
First, we should be looking for a confluence of the crossover of price and the 50 SMA line, and the reversal signal from the X Master Formula indicator. The crossover signal should occur at exactly the same moment as the X Master Formula indicator dots change color. This would be accompanied by an arrow pointing the direction of the trend reversal.
Then, we look at the Force Index indicator to assess if the line spiked. If it spiked, then it would be indicative of a strong momentum.
Finally, we should assess the crossover candle if it is a momentum candle. It should be a candle with a solid body and have small wicks.
If the market does trend, price would tend to stay at the same side of the 50 SMA line. The trade should be closed only when price closes on the opposite side of the 50 SMA line.
Indicators:
- 50 SMA (Green)
- Buysellpips (default setting)
- Force Index
Preferred Time Frames: 1-hour and 4-hour charts
Currency Pairs: major and minor pairs
Trading Sessions: Tokyo, London and New York sessions
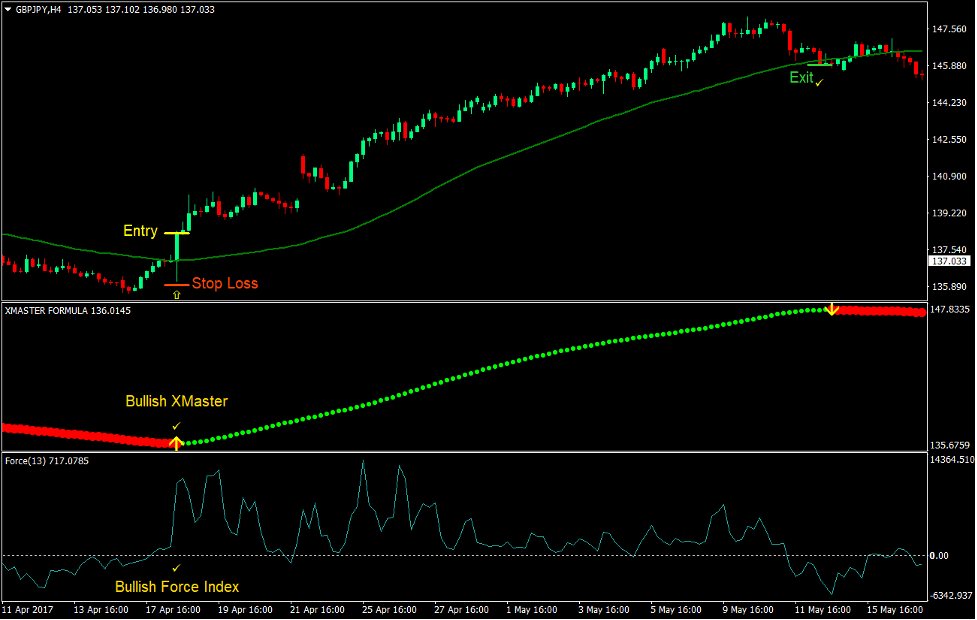
Buy Trade Setup
Entry
- Price should cross and close above the 50 SMA line.
- The price candle should be a bullish momentum candle.
- X Master Formula indicator should change to lime and plot an arrow pointing up.
- The Force Index line should spike up.
- These bullish signals should be aligned.
- Enter a buy order on the confirmation of these conditions.
Stop Loss
- Set the stop loss a few pips below the entry candle.
Exit
- Close the trade as soon as price closes below the 50 SMA line.
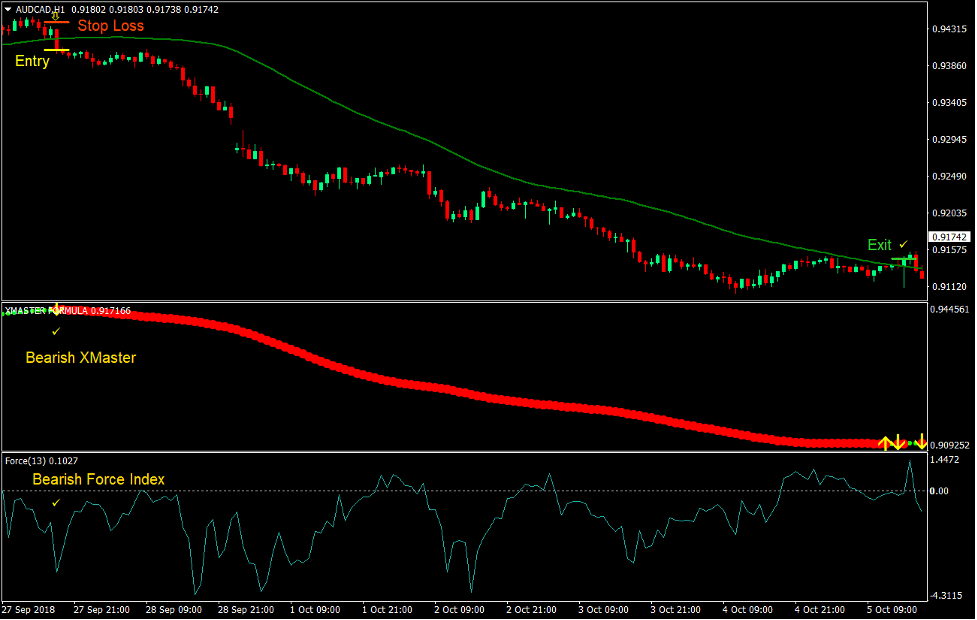
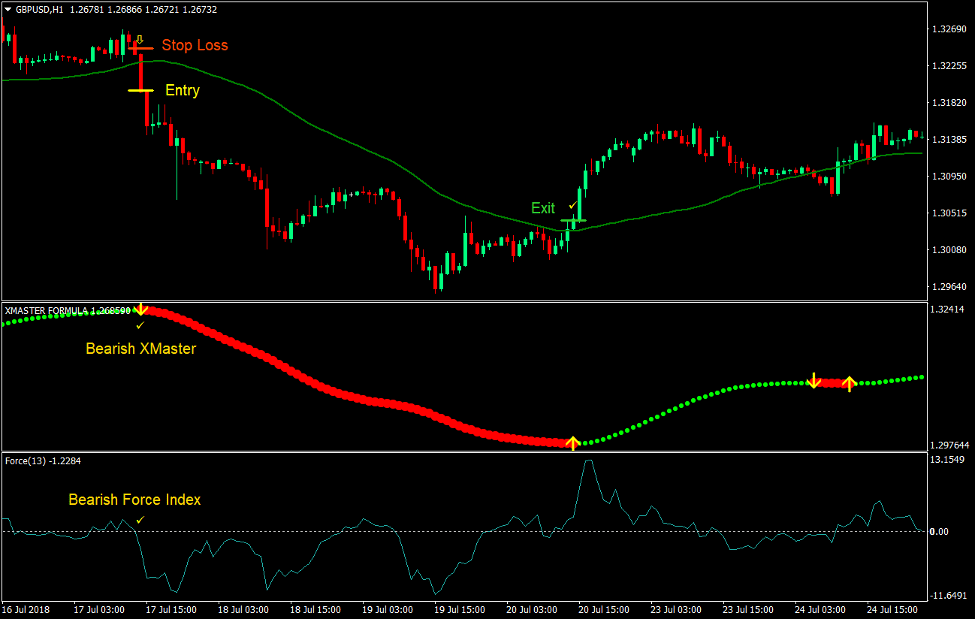
Sell Trade Setup
Entry
- Price should cross and close below the 50 SMA line.
- The price candle should be a bearish momentum candle.
- X Master Formula indicator should change to red and plot an arrow pointing down.
- The Force Index line should spike down.
- These bearish signals should be aligned.
- Enter a sell order on the confirmation of these conditions.
Stop Loss
- Set the stop loss a few pips above the entry candle.
Exit
- Close the trade as soon as price closes above the 50 SMA line.
Conclusion
Trading on crossovers of the 50 SMA line is quite a risky trade setup. That is why some traders call crossovers of the popular moving average lines as a death cross.
However, trading such crossovers could also be very rewarding if you are able to catch the right trend reversals.
This trade simply looks at the momentum behind the crossover as it is usually price movements with strong momentum that start a trend reversal.
Recommended MT4 Brokers
XM Broker
- Free $50 To Start Trading Instantly! (Withdraw-able Profit)
- Deposit Bonus up to $5,000
- Unlimited Loyalty Program
- Award Winning Forex Broker
- Additional Exclusive Bonuses Throughout The Year

>> Sign Up for XM Broker Account here <<
FBS Broker
- Trade 100 Bonus: Free $100 to kickstart your trading journey!
- 100% Deposit Bonus: Double your deposit up to $10,000 and trade with enhanced capital.
- Leverage up to 1:3000: Maximizing potential profits with one of the highest leverage options available.
- ‘Best Customer Service Broker Asia’ Award: Recognized excellence in customer support and service.
- Seasonal Promotions: Enjoy a variety of exclusive bonuses and promotional offers all year round.

>> Sign Up for FBS Broker Account here <<
Click here below to download: