


Inleiding tot de Value Charts-indicator
De Value Charts Indicator is ontwikkeld door David Stendahl om handelaren te helpen gemiddelde omkeringssignalen van extreme prijsniveaus te identificeren. Het is gebaseerd op het concept dat wordt uitgelegd in het boek "Dynamic Trading Indicators: Winning with Value Charts and Price Action Profile" door Mark Helweg en David Stendahl.
Wat is de Value Charts-indicator?
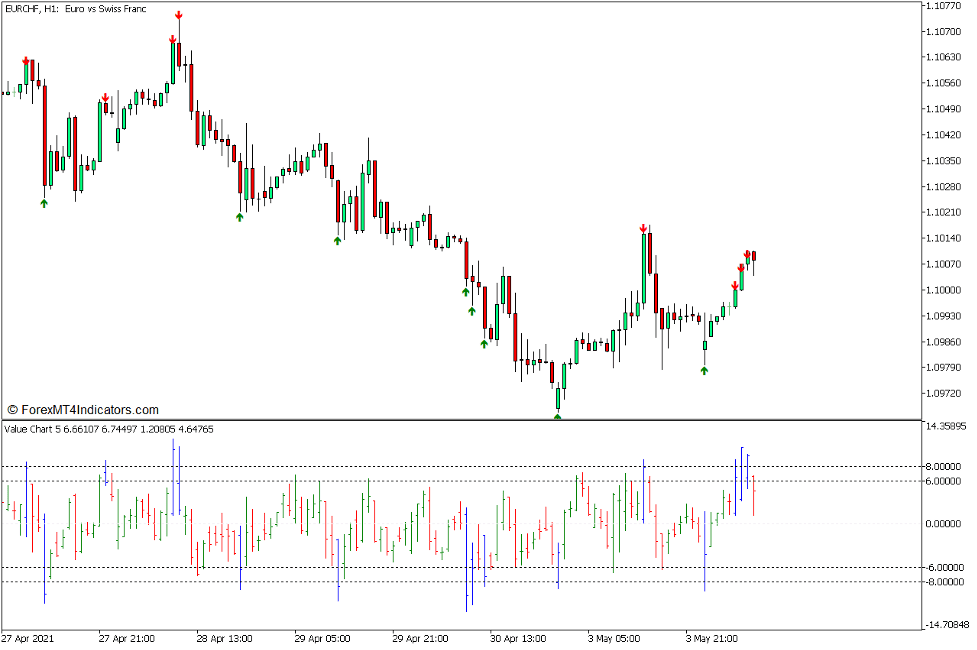
De Value Charts Indicator is een technische indicator van het type oscillator die de richting van het momentum aangeeft, evenals overbought en oversold prijsniveaus.
Deze indicator geeft staven weer die oscilleren binnen een bereik met een normale waarde tussen -8.00 en 8.00. De staven die worden geplot, zijn niet precies hetzelfde als bij de reguliere oscillatoren. Deze balken hebben punten die het gemiddelde vertegenwoordigen van de open, hoge, lage en gesloten gemiddelde prijsbewegingen. Het punt dat overeenkomt met het gemiddelde van de opening bevindt zich aan de linkerkant van elke balk, terwijl het punt dat overeenkomt met de sluiting aan de rechterkant van elke balk staat.
De kleuren van de balken geven ook de richting van het momentum aan, evenals overbought- en oversoldmarkten. Het zet groene balken uit om een bullish momentum aan te geven, rode balken om een bearish momentum aan te geven en blauwe balken om oververkochte en overbought markten aan te geven.
Het bereik van de Value Chart is ook gemarkeerd op niveaus -8.00, -6.00, 6.00 en 8.00. Het normale bereik ligt tussen -6.00 en 6.00. De niveaus onder -8.00 duiden echter op een oververkochte markt, terwijl niveaus boven de 8.00 duiden op een overboughtmarkt.
Hoe werkt de Value Charts-indicator?
Het algoritme van de Value Charts Indicator berekent voor het "Range Average", het gemiddelde verschil tussen hoog en laag. Het berekent ook voor het "Middengemiddelde", wat het gemiddelde is van de hoge en de lage. Vervolgens extrapoleert het verdere berekeningen op basis van de bovenstaande waarden, die vervolgens worden gebruikt om het bereik van elke staaf uit te zetten, evenals de significante punten die het gemiddelde van de open, hoge, lage en gesloten positie vertegenwoordigen.
De kleur van de balken verandert in blauw wanneer de hoge of lage waarde van een balk het bereik van -8.00 en 8.00 overschrijdt. Het verandert in rood wanneer het een bearish momentum detecteert, en groen wanneer het een bullish momentum detecteert. Het plot ook omkeerpijlen wanneer het een schending van het genoemde bereik detecteert.
Hoe de Value Charts Indicator voor MT5 te gebruiken
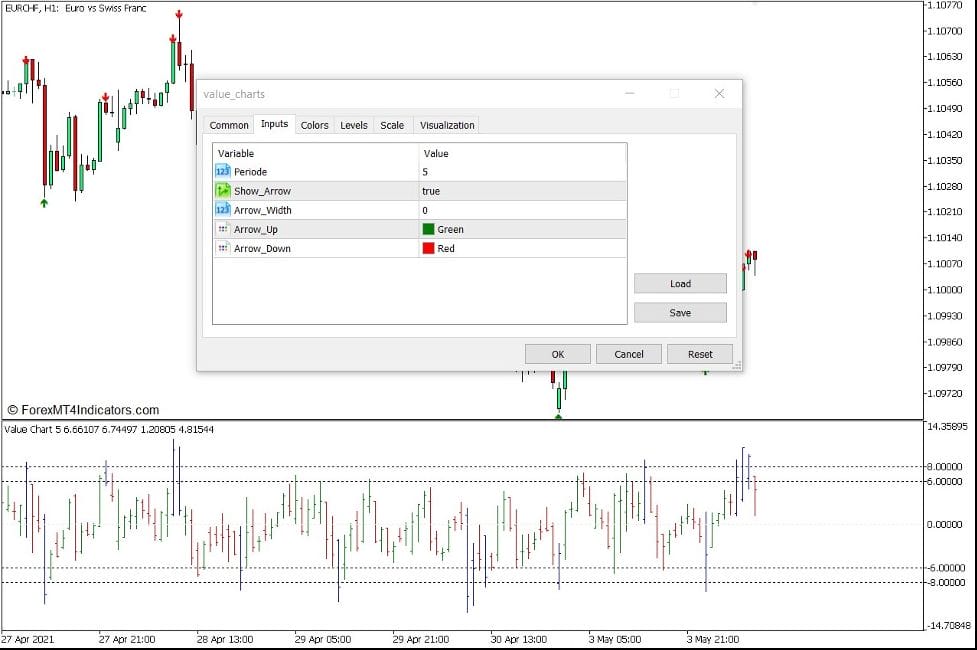
De Value Charts Indicator heeft een paar opties binnen zijn instellingen die zijn kenmerken kunnen wijzigen.
"Periode" verwijst naar het aantal balken dat de indicator gebruikt voor zijn berekeningen.
"Show_Arrow" schakelt de pijlsignalen in en uit.
"Arrow_Width" wijzigt de grootte van de pijl.
"Arrow_Up" en "Arrow_Down" wijzigen de kleur van de pijlsignalen.
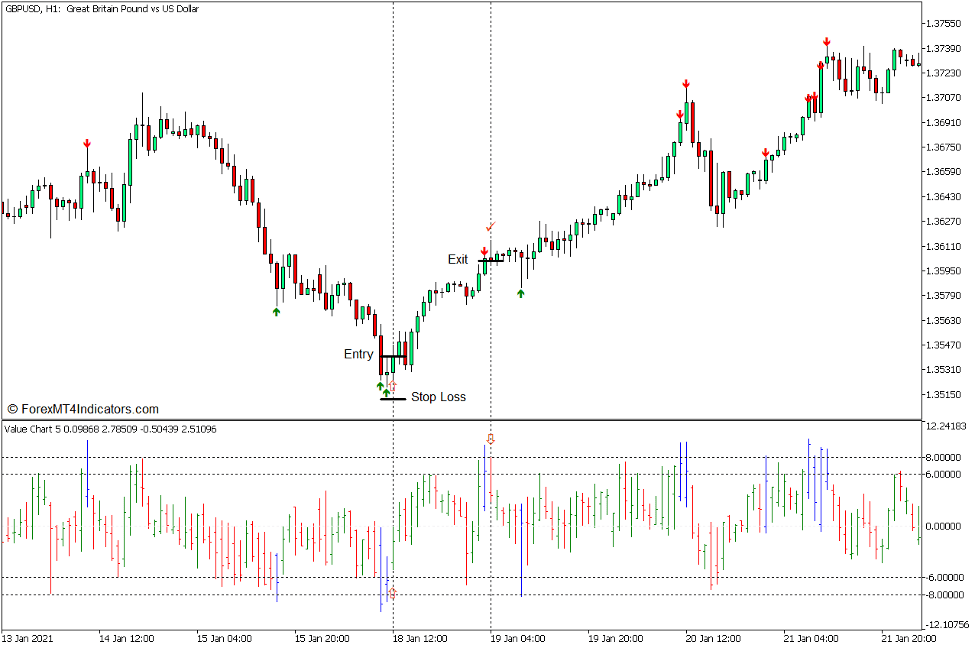
Koop Trade Setup
Wanneer invoeren?
Open een kooporder zodra een balk groen wordt, afkomstig van een blauwe balk die onder -8.00 zakt.
Wanneer uitstappen?
Laat de balken boven 8.00 schommelen en sluit de handel terwijl de balk rood wordt.
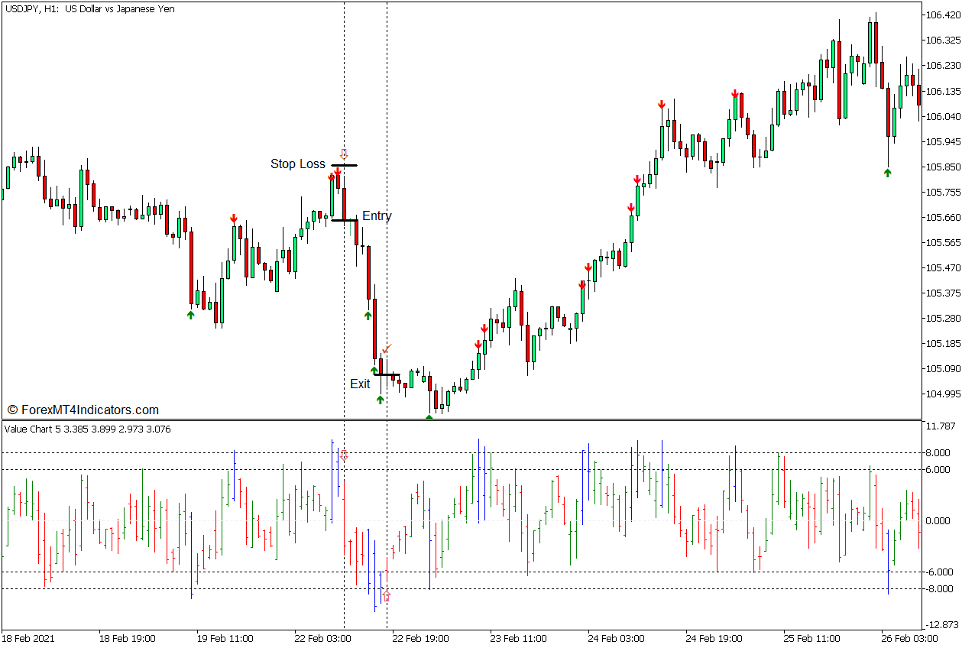
Verkoop handelsconfiguratie
Wanneer invoeren?
Open een verkooporder zodra een balk rood wordt, afkomstig van een blauwe balk die boven de 8.00 uitkomt.
Wanneer uitstappen?
Laat de balken onder de -8.00 schommelen en sluit de transactie wanneer de balk groen wordt.
Conclusie
Deze indicator is een zeer betrouwbare gemiddelde omkeringssignaalindicator. De signaalpijlen mogen echter niet worden gebruikt als een bevestigd gemiddeld omkeringssignaal, aangezien deze signalen worden gevormd wanneer de balken het normale bereik overschrijden. Omkeringen zijn beter gebaseerd op het veranderen van de kleur afkomstig van extreme niveaus.
Aanbevolen MT5-makelaars
XM-makelaar
- Gratis $ 50 Om direct te beginnen met handelen! (opneembare winst)
- Stortingsbonus tot $5,000
- Onbeperkt loyaliteitsprogramma
- Bekroonde Forex Broker
- Extra exclusieve bonussen Door het jaar heen

>> Meld u hier aan voor een XM Broker-account <
FBS-makelaar
- Handel 100 Bonus: Gratis $ 100 om uw handelsreis een vliegende start te geven!
- 100% Deposit Bonus: Verdubbel uw storting tot $10,000 en handel met meer kapitaal.
- Gebruik maximaal 1: 3000: Maximaliseren van potentiële winsten met een van de hoogste beschikbare hefboomopties.
- Award voor 'Beste Klantenservicemakelaar Azië': Erkende uitmuntendheid op het gebied van klantenondersteuning en service.
- Seizoensgebonden promoties: Geniet het hele jaar door van een verscheidenheid aan exclusieve bonussen en promotie-aanbiedingen.

>> Meld u hier aan voor een FBS-brokeraccount <

(Gratis downloaden van MT5-indicatoren)
Klik hieronder om te downloaden: