


Prijsactie, een van de meest gebruikte termen in de handel, maar verschillende handelaren hebben er verschillende beschrijvingen van. Sommigen suggereren dat het een analyse is van de basisbewegingen van de prijs die instap- en uitstapsignalen genereren en dat het opvalt omdat het geen gebruik van indicatoren vereist. Sommige handelaren identificeren het als de bewegingen van de prijs van een effect die in de loop van de tijd zijn uitgezet. Deze beschrijvingen kunnen voor sommige handelaren duidelijk zijn, maar voor sommigen ook erg vaag.
Persoonlijk zou ik prijsactie omschrijven als de kenmerken van prijsbewegingen uitgezet op een prijsgrafiek die kunnen helpen bij het aangeven van trendrichting, momentum, omkeringen, voortzettingen en vele andere marktscenario's die zich kunnen voordoen. Dit kan vaag zijn, maar als u elk van deze voorwaarden nauwkeurig zou bekijken, zou u prijsactiekenmerken zien die ons zouden kunnen helpen om elk van deze voorwaarden te identificeren. Uptrends kunnen bijvoorbeeld worden geïdentificeerd op basis van stijgende swing highs en swing lows, terwijl downtrends kunnen worden geïdentificeerd door een constante daling van de swing points. Momentum kan worden geïdentificeerd op basis van volle lange kaarsen die in één richting duwen. Omkeringen kunnen worden geïdentificeerd op basis van prijsafwijzingskenmerken, zoals lonten die tegen een prijsniveau duwen. Voortzettingen kunnen worden geïdentificeerd door een plotselinge duw in de richting van de trend direct na een retracement of contractie.
Hier zullen we kijken naar een trendvoortzettingsscenario waarin inzendingen worden geïdentificeerd op basis van prijsafwijzingen. Handelaren in pure prijsactie kunnen ook beweren dat prijsactie het gebruik van naakte grafieken vereist. Geen enkele regel weerhoudt ons er echter van om een paar technische indicatoren te gebruiken om ons te helpen bij het identificeren van een goede handelsopstelling.
HAMA
HAMA, Heiken Ashi Moving Average of Heiken Ashi Smoothed, ze kunnen door elkaar worden gebruikt. HAMA is een trendvolgende technische indicator die uitblinkt in het helpen van handelaren om de trendrichting duidelijk te identificeren. Het is karakteristiek zeer gevoelig voor prijsbewegingen, terwijl het tegelijkertijd niet te wispelturig is om gemakkelijk valse signalen te produceren.
HAMA is een uitloper of afgeleide van de Heiken Ashi-kandelaars en een standaard Exponential Moving Average (EMA) -lijn. Het produceert staven die van kleur veranderen om de richting van de trend aan te geven, terwijl het tegelijkertijd deze staven uitzet met dezelfde reactiesnelheid als de EMA-lijn.
Heiken Ashi betekent in het Japans letterlijk gemiddelde repen. In zekere zin is dit wat de HAMA doet. Het middelt historische prijsgegevens. De resulterende berekening wordt vervolgens uitgezet als staven over de prijsgrafiek. De kleur van de balken verandert afhankelijk van de richting van de trend. Blauwe balken geven een bullish trend aan, terwijl rode balken een bearish trend aangeven. Bijgevolg kunnen kleurveranderingen wijzen op een mogelijke trendomkering.
RAVI
RAVI staat in feite voor Range Action Verification Index. Deze indicator vertegenwoordigt de relatieve convergentie of divergentie van een onderliggend voortschrijdend gemiddelde van een verhandelbaar instrument, honderd keer verhoogd. De gebaseerde RAVI-configuratie is gebaseerd op een onderliggende 13-periode Simple Moving Average (SMA). Het was oorspronkelijk gebaseerd op een periode van 13 weken, wat overeenkomt met een periode van 3 maanden. Gezien de technologie en snelheid van handelen tegenwoordig, kan het echter ook worden toegepast op de lagere tijdframes.
De RAVI-indicator is een technische indicator van het oscillatortype. Het zet staven uit die oscilleren rond de middellijn, nul. Positieve balken geven een bullish trendbias aan, terwijl negatieve balken een bearish trendbias aangeven.
De versterking van een trendmomentum kan ook worden geïdentificeerd aan de hand van de kleur van de balken. Groene balken geven een sterker wordende bullish trend aan, terwijl rode balken een sterker wordende bearish trend aangeven. Grijze balken geven daarentegen een neutraal momentum aan, of het nu bullish of bearish is.
Traders kunnen deze indicator gebruiken als een ingangssignaal voor trendomkering op basis van het verschuiven van de balken. Het kan ook worden gebruikt als een trendrichtingfilter om handelaren te helpen voorkomen dat ze tegen de trend in handelen.
Trading strategie
RAVI HAMA Push Forex Trading Strategy handelt met de richting van een bestaande trend waarbij prijsafwijzing het belangrijkste ingangssignaal is.
Eerst wordt de trendrichting geïdentificeerd op basis van de kleur van de HAMA-balken. Een dergelijke trendrichting wordt vervolgens bevestigd op basis van het stijgende of dalende schommelpuntpatroon van prijsactie. De RAVI-balken moeten ook de trendrichting bevestigen op basis van het feit of de balken over het algemeen positief of negatief zijn. Trades worden uitsluitend in de richting van de trend genomen.
Zodra we de trend en handelsrichting isoleren, wachten we tot de prijs terugkeert naar het gebied van de HAMA-repen. Prijsactie moet tekenen van prijsafwijzing vertonen wanneer deze de HAMA-balken nadert of raakt. Dit is gebaseerd op lonten die tegen de HAMA-staven duwen. Dit zou ons ingangssignaal zijn.
Indicatoren:
- HAMA_
- Ravisignaal
Voorkeurstermijnen: 30 minuten, 1 uur, 4 uur en dagelijkse grafieken
Valutaparen: FX majors, minors en crosses
Handelssessies: Sessies Tokio, Londen en New York
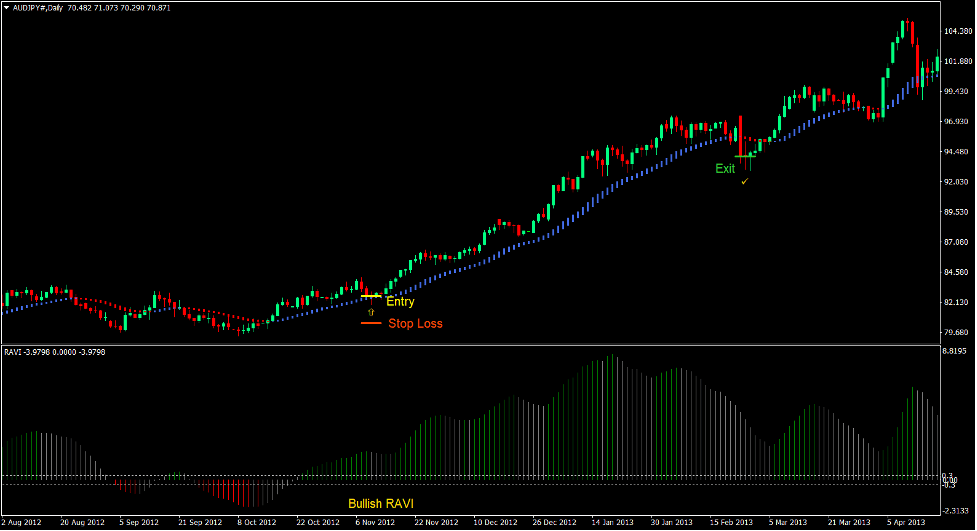
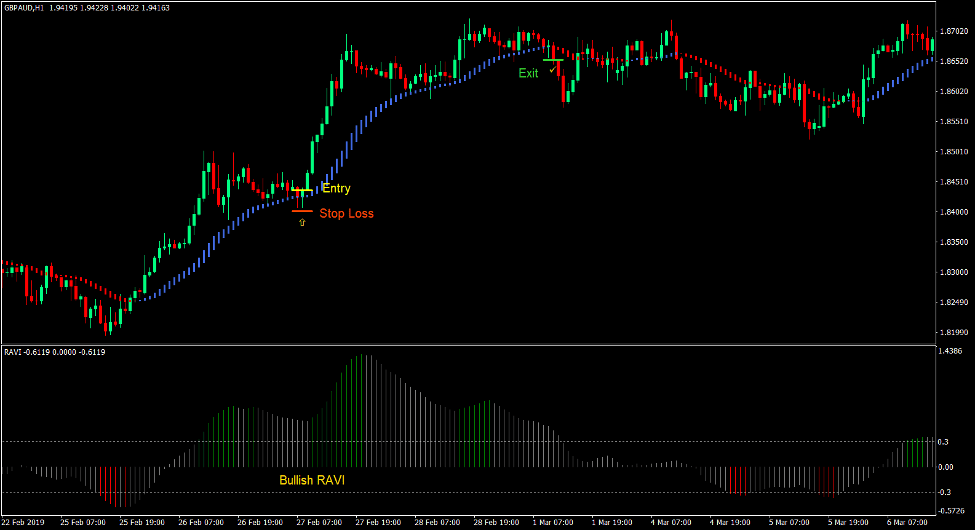
Koop Trade Setup
binnenkomst
- De HAMA-balken moeten blauw zijn.
- De swing highs en swing lows zouden moeten stijgen.
- De RAVI-balken moeten positief zijn.
- De prijs zou zich moeten terugtrekken in de richting van de HAMA-repen.
- De prijs moet het prijsniveau van de HAMA-repen verwerpen dat wordt aangegeven door lonten die ertegen duwen.
- Voer een kooporder in bij de bevestiging van bovenstaande voorwaarden.
Stop Loss
- Stel de stop loss in op de steun onder de instapkaars.
- Stel de stop loss in onder de HAMA-balken.
afrit
- Sluit de handel zodra de HAMA-balken rood worden.
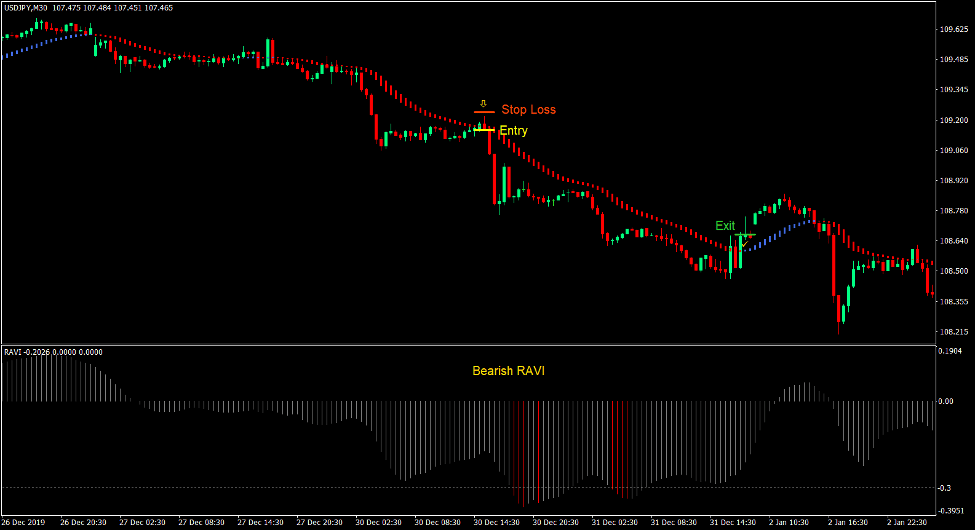
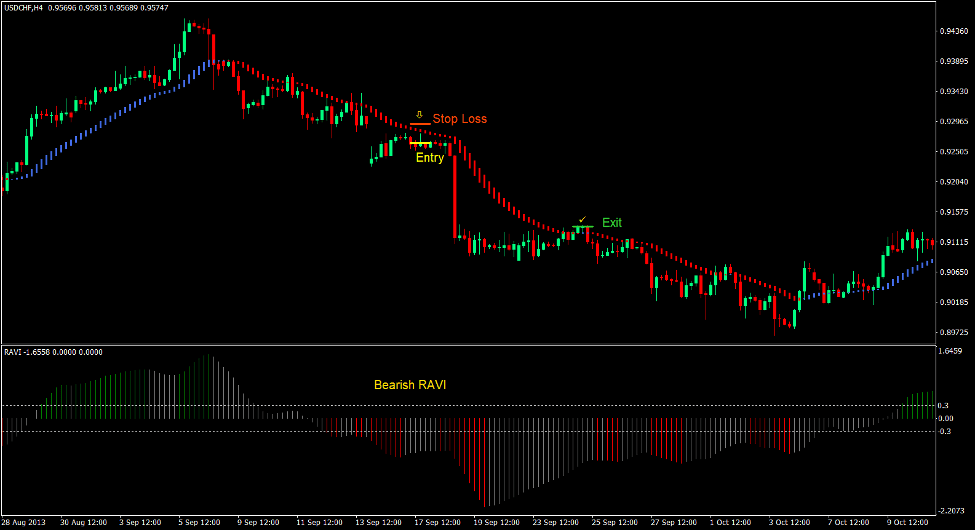
Verkoop handelsconfiguratie
binnenkomst
- De HAMA-balken moeten rood zijn.
- De swing highs en swing lows zouden moeten dalen.
- De RAVI-balken moeten negatief zijn.
- De prijs zou zich moeten terugtrekken in de richting van de HAMA-repen.
- De prijs moet het prijsniveau van de HAMA-repen verwerpen dat wordt aangegeven door lonten die ertegen duwen.
- Voer een verkooporder in bij de bevestiging van bovenstaande voorwaarden.
Stop Loss
- Stel de stop loss in op de weerstand boven de instapkaars.
- Stel de stop loss in boven de HAMA-balken.
afrit
- Sluit de transactie zodra de HAMA-balken blauw worden.
Conclusie
Deze handelsstrategie is een basisstrategie voor het volgen en voortzetten van trends, die prijsafwijzing bevat om specifieke toegangspunten te identificeren. Hierdoor kunnen wij als handelaren tegen een betere prijs instappen in plaats van te laat te zijn om een trend in te gaan.
Deze strategie kan consistente winst opleveren bij gebruik in de juiste trending marktomstandigheden.
Aanbevolen MT4-makelaars
XM-makelaar
- Gratis $ 50 Om direct te beginnen met handelen! (opneembare winst)
- Stortingsbonus tot $5,000
- Onbeperkt loyaliteitsprogramma
- Bekroonde Forex Broker
- Extra exclusieve bonussen Door het jaar heen

>> Meld u hier aan voor een XM Broker-account <
FBS-makelaar
- Handel 100 Bonus: Gratis $ 100 om uw handelsreis een vliegende start te geven!
- 100% Deposit Bonus: Verdubbel uw storting tot $10,000 en handel met meer kapitaal.
- Gebruik maximaal 1: 3000: Maximaliseren van potentiële winsten met een van de hoogste beschikbare hefboomopties.
- Award voor 'Beste Klantenservicemakelaar Azië': Erkende uitmuntendheid op het gebied van klantenondersteuning en service.
- Seizoensgebonden promoties: Geniet het hele jaar door van een verscheidenheid aan exclusieve bonussen en promotie-aanbiedingen.

>> Meld u hier aan voor een FBS-brokeraccount <
Klik hieronder om te downloaden: