


Hebzucht is een van de belangrijkste redenen waarom handelaren geld verliezen bij het handelen op de forexmarkt. Veel nieuwe handelaren worden verleid om op de forexmarkt te handelen vanwege de enorme rendementen die zij andere handelaars zien behalen. Traders willen vaak meteen groots worden. Traders mikten dus vaak op de sterren bij het handelen op de forexmarkt. Ze zouden proberen enorme rendementen te behalen met zo min mogelijk risico. Vaak streven handelaren naar onmogelijke doelen. Dit zou er vaak voor zorgen dat wat winnende transacties hadden moeten zijn, in verliezende transacties veranderde. Dit is waarschijnlijk een van de meest pijnlijke scenario's bij het handelen op de forexmarkt.
In tegenstelling tot wat vaak wordt gedacht, is handelen echter geen manier om snel rijk te worden. In plaats daarvan is het een dagelijkse sleur. Handelaren moeten hun rekeningen langzaam maar zeker beetje bij beetje laten groeien. In plaats van te streven naar onmogelijke doelen, is het soms het beste om de markt gewoon te laten vertellen wat hij je wil geven. In plaats van vast te houden aan een transactie in de hoop dat de prijs verder in een bepaalde richting zou gaan, zouden traders over een middel moeten beschikken om eerder te kunnen vaststellen of de markt op het punt staat om te keren ten opzichte van hun posities. Handelaren die mechanisch de markt zouden kunnen betreden en verlaten op basis van een logische voorwaarde, kunnen consistente winsten behalen op de forexmarkt.
Kaarsen stoppen
Candle Stop is een aangepaste technische momentumindicator die een variatie is op een kanaaltype indicator.
Deze indicator is uitgezet in stippellijnen die de beweging van de prijsactie volgen. Deze lijnen worden uitgezet op basis van een historische beweging van prijsextremen. De lijnen zijn in feite de hoogste en laagste punten van prijsactie binnen een bepaalde periode en zijn naar rechts verschoven. Dit creëert een kanaalachtige structuur die extreme prijsbewegingsniveaus zou markeren.
De stippellijnen kunnen worden gebruikt als volatiliteitsindicator. Aangezien de lijnen gebaseerd zijn op prijsextremen, kunnen handelaren nu gemakkelijk visualiseren of de prijsactie krimpt of uitbreidt. De lijnen krimpen naarmate de marktvolatiliteit kleiner wordt en worden groter naarmate de marktvolatiliteit toeneemt.
De lijnen kunnen ook worden gebruikt als basis voor momentumuitbraken. Een sterke momentumkaars die buiten het kanaal breekt, zou erop kunnen wijzen dat de markt uit de marktkrimpfase komt en mogelijk een trend begint te vertonen. Deze opstellingen kunnen worden gebruikt door handelaren die momentumstrategieën verhandelen.
De lijnen kunnen ook worden gebruikt als stop loss-basis of als trailing stop loss-markering. Aangezien de lijnen gebaseerd zijn op prijsextremen, kunnen handelaren stopverliezen plaatsen op de lijn die tegengesteld is aan de richting van hun handel.
Drive
Drive is een aangepaste technische indicator die deel uitmaakt van de oscillatorfamilie van technische indicatoren. Het identificeert en geeft momentum aan op basis van twee oscillerende lijnen.
Deze indicator tekent twee lijnen: één lijn is groen en de andere lijn is rood. Trendrichting of momentum wordt geïdentificeerd op basis van hoe de twee lijnen elkaar overlappen.
Er wordt gezegd dat de markt bullish is wanneer de groene lijn boven de rode lijn ligt, en bearish wanneer de groene lijn onder de rode lijn ligt.
Deze indicator kan worden gebruikt als een momentumfilterindicator, waardoor handelaren worden verhinderd tegen de richting van het huidige marktmomentum in te handelen. Het kan ook worden gebruikt als toegangssignaal, op voorwaarde dat het samenvalt met andere complementaire handelssignalen.
Trading strategie
Momentum Drive Forex Trading Strategy is een eenvoudige momentum-handelsstrategie gebaseerd op twee complementaire technische indicatoren.
Ten eerste moeten we een markt identificeren die net is begonnen met het omkeren en een nieuwe trend begint. Dit wordt geïdentificeerd op basis van de kenmerken van prijsactie, evenals prijsactie die de EMA-lijn (Exponentieel voortschrijdend gemiddelde) over 50 perioden overschrijdt.
Vervolgens wachten we op prijsactie om de nieuwe trend te bevestigen op basis van de terugkeer naar de richting van de 50 EMA-lijn, gevolgd door een prijsafwijzing met een sterk momentum.
De retracement kan worden geïdentificeerd op basis van prijssluiting binnen het gebied van de Candle Stop-lijnen.
Dit zou dan moeten worden gevolgd door een sterke momentumkaars die buiten de Candle Stop-lijnen sluit in de richting van de nieuwe trend.
Deze momentum breakout-opstelling moet vervolgens worden bevestigd door de Drive-indicator. De bevestiging is gebaseerd op hoe de groene en rode lijnen elkaar overlappen, wat zou moeten overeenkomen met de trendrichting van prijsactie en de 50 EMA-lijn.
Indicatoren:
- KaarsStop
- 50 EMA
- Drive
Voorkeurstermijnen: Grafieken van 15 minuten, 30 minuten, 1 uur en 4 uur
Valutaparen: FX majors, minors en crosses
Handelssessies: Sessies Tokio, Londen en New York
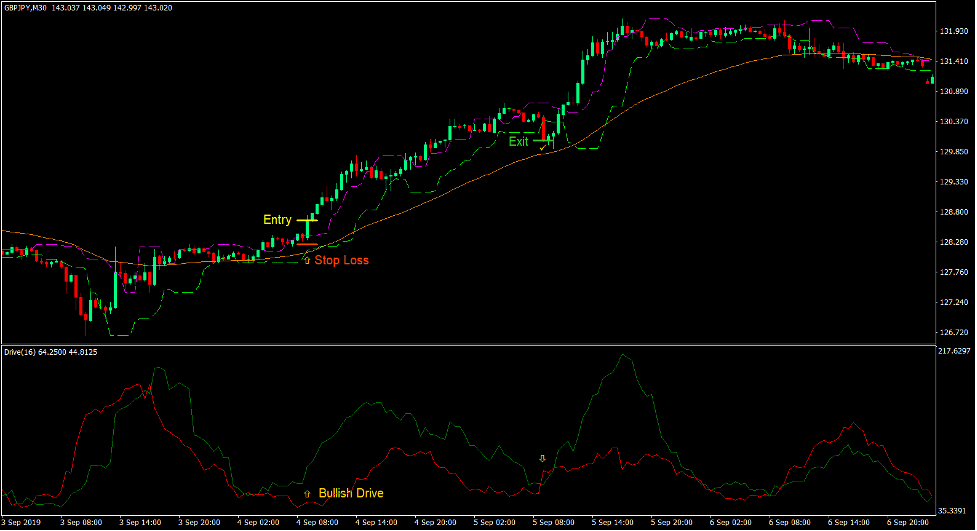
Koop Trade Setup
binnenkomst
- Prijsactie zou boven de 50 EMA-lijn moeten komen.
- De 50 EMA-lijn zou omhoog moeten gaan.
- Prijsactie zou terug moeten gaan naar het gebied tussen de twee lijnen van de Candle Stop-indicator.
- Een sterke bullish momentumkaars zou boven de magenta lijn van de Candle Stop-indicator moeten sluiten.
- De groene lijn van de Drive-indicator moet boven de rode lijn liggen.
- Voer een kooporder in bij de bevestiging van deze voorwaarden.
Stop Loss
- Stel de stop loss in onder de instapkaars.
afrit
- Sluit de transactie zodra de groene lijn van de Drive-indicator onder de rode lijn komt.

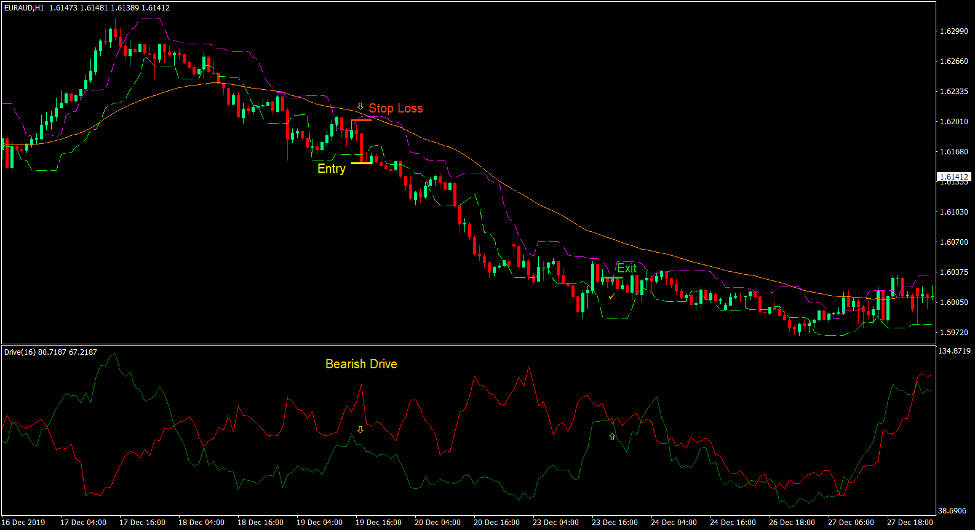
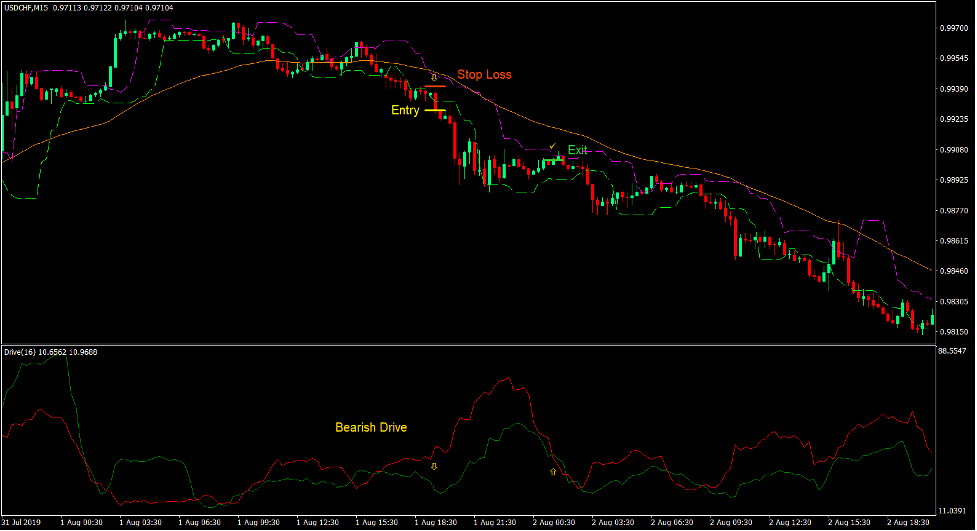
Verkoop handelsconfiguratie
binnenkomst
- Prijsactie zou onder de 50 EMA-lijn moeten komen.
- De 50 EMA-lijn zou naar beneden moeten gaan hellen.
- Prijsactie zou terug moeten gaan naar het gebied tussen de twee lijnen van de Candle Stop-indicator.
- Een sterke bearish momentumkaars zou onder de kalklijn van de Candle Stop-indicator moeten sluiten.
- De groene lijn van de Drive-indicator moet zich onder de rode lijn bevinden.
- Voer een verkooporder in bij de bevestiging van deze voorwaarden.
Stop Loss
- Stel de stop loss in boven de instapkaars.
afrit
- Sluit de transactie zodra de groene lijn van de Drive-indicator boven de rode lijn uitkomt.
Conclusie
Dit is een nieuw type momentum-breakout-strategie die is gebaseerd op de Candle Stop-indicator.
Net als bij andere momentum breakout-handelsstrategieën die bandgebaseerde indicatoren bevatten, werkt deze indicator ook goed omdat hij marktinkrimpingen en -uitbreidingen identificeert.
Deze strategie is echter gericht op trends op de kortere termijn. Het handelt in de richting van de nieuwe trend terwijl het op breakouts handelt.
Wanneer u met deze strategie handelt, kunt u ook het beste rekening houden met koersdalingen voorbij het vorige kleine swingpoint. Dit zorgt ervoor dat het vorige steun- of weerstandsniveau werd doorbroken.
Aanbevolen MT4-makelaars
XM-makelaar
- Gratis $ 50 Om direct te beginnen met handelen! (opneembare winst)
- Stortingsbonus tot $5,000
- Onbeperkt loyaliteitsprogramma
- Bekroonde Forex Broker
- Extra exclusieve bonussen Door het jaar heen

>> Meld u hier aan voor een XM Broker-account <
FBS-makelaar
- Handel 100 Bonus: Gratis $ 100 om uw handelsreis een vliegende start te geven!
- 100% Deposit Bonus: Verdubbel uw storting tot $10,000 en handel met meer kapitaal.
- Gebruik maximaal 1: 3000: Maximaliseren van potentiële winsten met een van de hoogste beschikbare hefboomopties.
- Award voor 'Beste Klantenservicemakelaar Azië': Erkende uitmuntendheid op het gebied van klantenondersteuning en service.
- Seizoensgebonden promoties: Geniet het hele jaar door van een verscheidenheid aan exclusieve bonussen en promotie-aanbiedingen.

>> Meld u hier aan voor een FBS-brokeraccount <
Klik hieronder om te downloaden: