


Marktomkeringen zijn uitstekende handelsmogelijkheden waarbij handelaren winst kunnen maken op de markt. Veel handelaren vinden het misschien riskant, vooral omdat handelaren vaak tegen een gevestigde trend in handelen. Met de juiste handelskansen kunnen marktomkeerstrategieën echter een uitstekende marktvoorsprong bieden die handelaren kunnen gebruiken om van de markt te profiteren.
De hieronder besproken strategie is een voorbeeld van een omkeerhandelsstrategie die een systematische handelsopstelling biedt op basis van verschillen.
i-Spectr Analyse OsMA-indicator
De i-Spectr Analysis OsMA Indicator is een aangepaste technische indicator die is gebaseerd op de Oscillator of Moving Averages (OsMA) Indicator.
Zoals de naam al doet vermoeden, is de klassieke OsMA-indicator een oscillator die is afgeleid van een voortschrijdend gemiddelde van een ander oscillatortype indicator. De meest gebruikte onderliggende oscillator voor een OsMA-indicator is de Moving Average Convergence and Divergence (MACD).
De OsMA-indicator heeft een algoritme dat het voortschrijdend gemiddelde van de onderliggende oscillatorwaarden berekent. Vervolgens berekent het het verschil tussen de onderliggende oscillatorwaarde en het voortschrijdend gemiddelde. Het resulterende verschil wordt vervolgens gebruikt om de oscillatorhistogrambalken of oscillatorlijn uit te zetten.
OsMA = Oscillatorwaarde – voortschrijdende gemiddelde waarde van de onderliggende oscillator
De i-Spectr Analysis OsMA Indicator gebruikt ook een onderliggende MACD om de OsMA-balken te berekenen. Het wijzigt ook zijn berekeningen door tijdens zijn berekeningen gebruik te maken van het exponentieel voortschrijdend gemiddelde (EMA). Gebruikers kunnen ook de parametervariabelen van de onderliggende MACD wijzigen binnen de instellingen van de indicator. Een uniek kenmerk van de OsMA-indicator is dat deze ook een afvlakkingsfactor heeft. Hierdoor kan de indicator oscillaties plotten die veel vloeiender zijn in vergelijking met andere OsMA-indicatoren.
Deze OsMA-indicator tekent histogrambalken uit om de oscillaties weer te geven. Het heeft ook een functie waarbij de kleur van de balken verandert afhankelijk van de richting van de oscillaties. Positieve balken met toenemende waarden zijn blauw gekleurd, terwijl positieve balken met afnemende waarden groen gekleurd zijn. Negatieve balken met afnemende waarden zijn magenta gekleurd, terwijl negatieve balken met toenemende waarden paars zijn gekleurd. Met deze functie kunnen gebruikers eenvoudig potentiële momentumomkeringen identificeren, evenals de verzwakking of versterking van de trend.

Divergenties en omkeringen
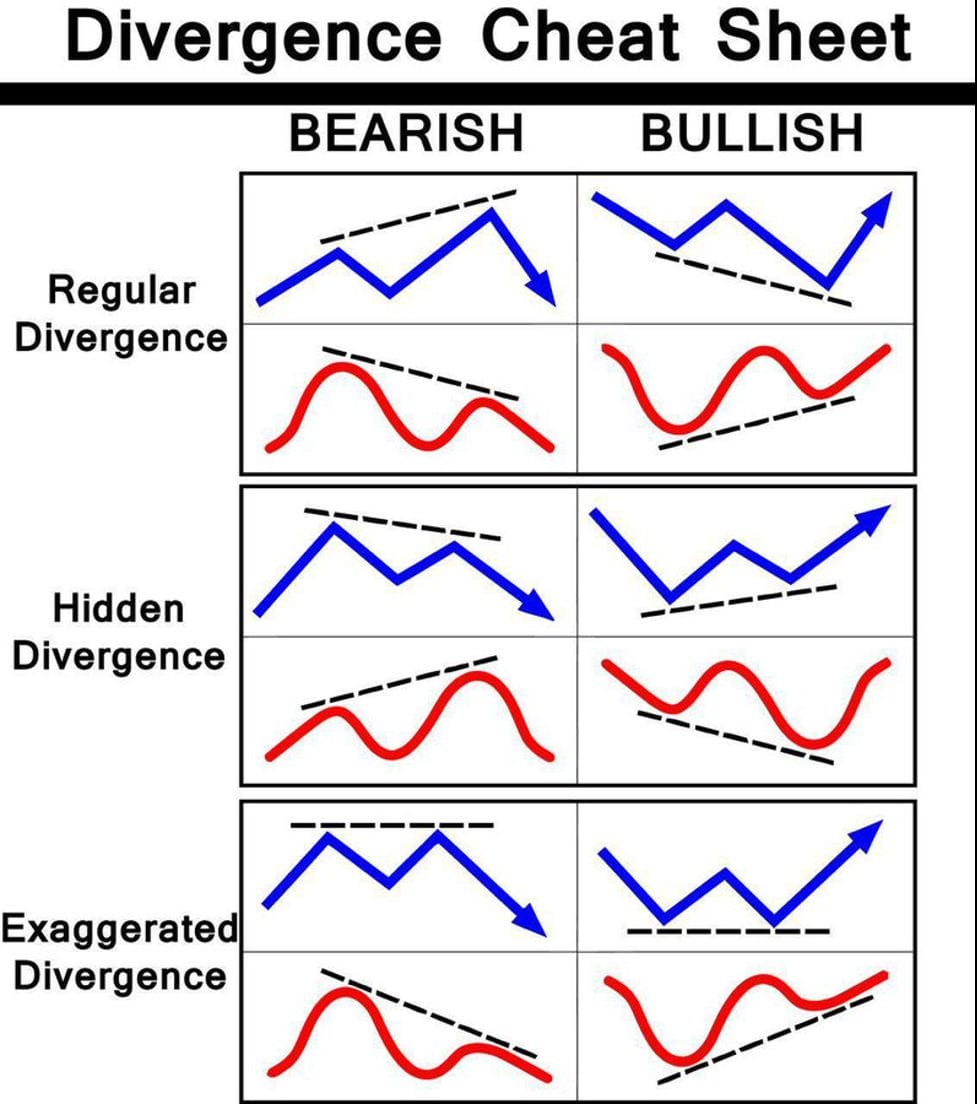
Bij het in kaart brengen van handels- en technische analyses zijn verschillen in feite scenario's waarin er afwijkingen zijn tussen de richting of het traject van prijsactie in vergelijking met een indicator, met name een indicator van het oscillatortype.
Hoewel prijsgrafieken vaak grillig lijken zonder enige duidelijke richting, weten technische handelaars die prijsgrafieken voldoende hebben geobserveerd dat de prijs doorgaans op een golfachtige manier op en neer schommelt in de prijsklasse. Deze golfachtige structuren worden gevormd door de impulsen die de markt maakt terwijl deze op en neer beweegt, waardoor pieken en dalen ontstaan die swing highs en swing lows worden genoemd. Dit kenmerk is wat veel handelaren prijsactie noemen.
Oscillatoren bootsen doorgaans de bewegingen van prijsactie na. Dit is de reden waarom de schommelingen van prijsactie vaak in lijn liggen met de schommelingen van een technische indicator. Hieruit volgt ook dat oscillatoren doorgaans het traject van prijsactie nabootsen. Als prijsactie hogere swinghighs en swinglows maakt, zou de bijbehorende oscillator gewoonlijk hetzelfde doen. Omgekeerd, als prijsactie lagere swinghighs en swinglows maakt, zou dezelfde oscillator ook hetzelfde traject moeten volgen.
Er zijn echter situaties waarin het traject van de swinghighs en swinglows van prijsactie zou verschillen van dat van de overeenkomstige oscillator. Prijsactie kan hogere swing-lows maken, terwijl een oscillator lagere dips maakt, of omgekeerd. Het kan ook zijn dat prijsactie lagere swinghighs maakt, terwijl de overeenkomstige oscillator hogere swinghighs maakt, of omgekeerd. Deze scenario's worden divergenties genoemd. Dergelijke marktscenario's zijn veelbetekenende tekenen van een mogelijke marktomkering waarop handelaren kunnen reageren.
De onderstaande grafiek toont de verschillende soorten afwijkingen die handelaren kunnen gebruiken.
Handelsstrategieconcept
i-Spectr-analyse OsMA Divergentie Forex-handelsstrategie voor MT5 is een eenvoudige handelsstrategie voor momentumomkering die divergenties gebruikt als basis voor het identificeren van mogelijke marktomkeringen. Het gebruikt de i-Spectr Analysis OsMA Indicator als basis voor het identificeren van mogelijke verschillen in vergelijking met de overeenkomstige prijsactie van het verhandelbare instrument dat het vertegenwoordigt.
Handelaren kunnen de kleurverandering van de balken gebruiken om de pieken en bodems van de i-Spectr Analysis OsMA-oscillaties te identificeren en deze te vergelijken met de oscillaties van prijsactie voor eenvoudiger referentie.
Zodra een geldige divergentie wordt vastgesteld, kunnen handelaren dezelfde kleurverandering op de tweede piek of onderkant van de oscillatorbalken gebruiken als bevestiging van de momentumomkering.
Koop Trade Setup
binnenkomst
- Identificeer een geldige bullish divergentie door de swing-lows van prijsactie te vergelijken met de dips op de i-Spectr Analysis OsMA-staven.
- Een bullish handelssignaal kan worden bevestigd zodra de kleur van de i-Spectr Analysis OsMA-balken naar paars verandert bij de tweede dip van de oscillator.
Stop Loss
- Stel de stop loss in onder de instapkaars.
afrit
- Stel het take-profitdoel in op het niveau van het volgende swing high-gebied boven de handelsinvoer.

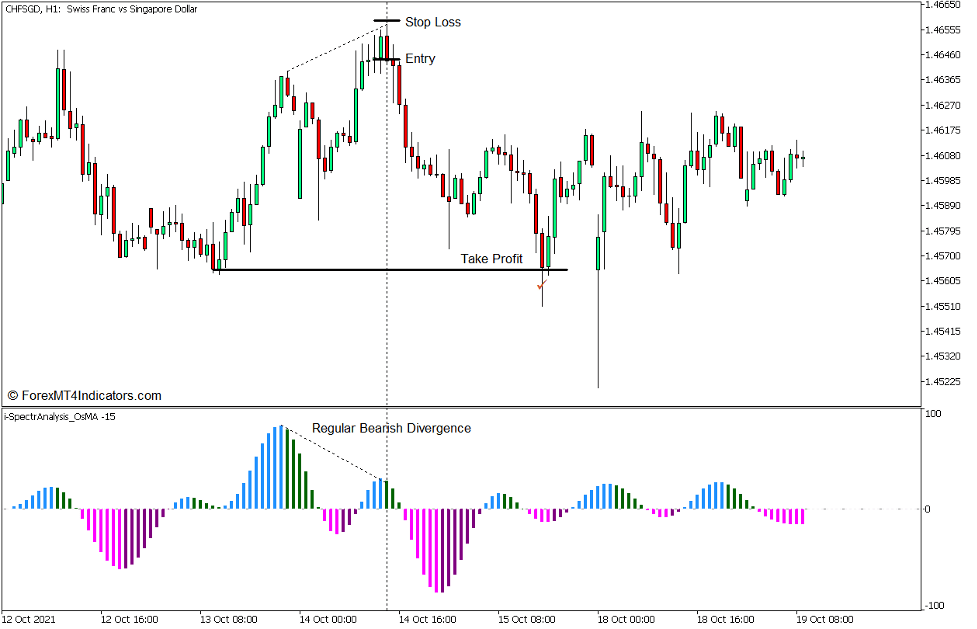
Verkoop handelsconfiguratie
binnenkomst
- Identificeer een geldige bearish divergentie door de swinghighs van prijsactie te vergelijken met de pieken op de i-Spectr Analysis OsMA-staven.
- Een bearish handelssignaal kan worden bevestigd zodra de kleur van de i-Spectr Analysis OsMA-balken op de tweede piek van de oscillator naar groen verandert.
Stop Loss
- Stel de stop loss in boven de instapkaars.
afrit
- Stel het take-profitdoel in op het niveau van het volgende swing-low-gebied onder de handelsinvoer.
Conclusie
Afwijkingen zijn enkele van de meest effectieve omkeerhandelssignalen die handelaren kunnen gebruiken. Veel professionele handelaren die divergenties gebruiken, zouden zeggen dat dit vaak resulteert in een winstkans van 1 op de 3 transacties. Dat lijkt misschien niet veel, maar met de juiste risico-opbrengstverhouding zou dit winstpercentage zeer winstgevend zijn. De vraag is welke oscillator handelaren moeten gebruiken.
De hierboven besproken i-Spectr Analysis OsMA-indicator lijkt effectief te zijn bij het identificeren van geldige verschillen. Het moet echter ook gepaard gaan met een gedegen analyse van de marktstructuur en een goed inzicht in prijsactie. Als u dit wel doet, kunnen uw handelssignalen verbeteren, vooral als u deze in het juiste marktscenario gebruikt.
Aanbevolen MT5-makelaars
XM-makelaar
- Gratis $ 50 Om direct te beginnen met handelen! (opneembare winst)
- Stortingsbonus tot $5,000
- Onbeperkt loyaliteitsprogramma
- Bekroonde Forex Broker
- Extra exclusieve bonussen Door het jaar heen

>> Meld u hier aan voor een XM Broker-account <
FBS-makelaar
- Handel 100 Bonus: Gratis $ 100 om uw handelsreis een vliegende start te geven!
- 100% Deposit Bonus: Verdubbel uw storting tot $10,000 en handel met meer kapitaal.
- Gebruik maximaal 1: 3000: Maximaliseren van potentiële winsten met een van de hoogste beschikbare hefboomopties.
- Award voor 'Beste Klantenservicemakelaar Azië': Erkende uitmuntendheid op het gebied van klantenondersteuning en service.
- Seizoensgebonden promoties: Geniet het hele jaar door van een verscheidenheid aan exclusieve bonussen en promotie-aanbiedingen.

>> Meld u hier aan voor een FBS-brokeraccount <
Klik hieronder om te downloaden: