


Technische handelaren hebben geprobeerd statistieken op te nemen in de handel. Een handelsvoordeel op basis van technische analyse is immers afhankelijk van waarschijnlijkheden. Veel pogingen daartoe blijken echter vaak zinloos te zijn. Een concept uit de statistieken dat enige belofte toont en in feite door veel handelaren wordt gebruikt, is lineaire regressie. Deze strategie toont ons een voorbeeld van een indicator die lineaire regressie gebruikt om handelaren te helpen een prijsgrafiek te begrijpen.
i-regressie-indicator
De i-Regressie-indicator is een op maat gemaakte technische indicator die is gebaseerd op een statistisch concept dat lineaire regressie wordt genoemd. Een dergelijk gebruik van lineaire regressies stelt handelaren in staat om gemakkelijker prijskanalen te identificeren.
Deze indicator is ontwikkeld om prijskanalen automatisch te identificeren met behulp van lineaire regressie als basis voor het uitzetten van het bereik van het kanaal. Het doet dit door gebruik te maken van het concept van een Bell Curve. Het identificeert vervolgens de gemiddelde prijs op basis van de verdeling van de prijs. De volgende stap die het algoritme doet, is het gebruik van standaarddeviaties om de buitengrenzen van het bereik zodanig te berekenen dat een bepaald percentage van de prijspunten binnen het bereik valt. Bijvoorbeeld, een standaarddeviatie van twee benadert dat ongeveer 95% van de prijsgegevenspunten binnen het bereik van het kanaal vallen.
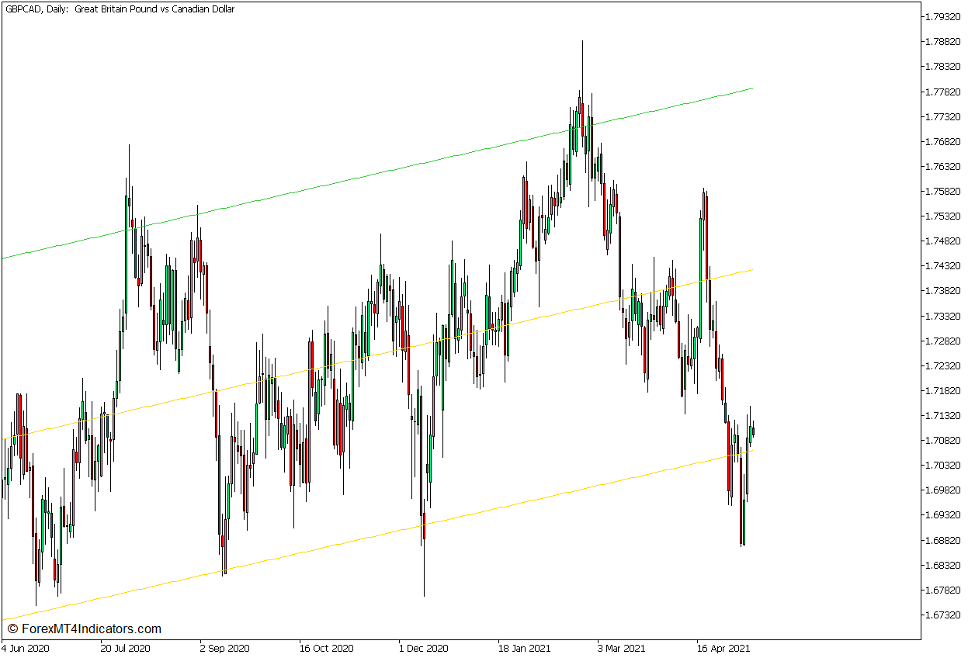
De i-regressie-indicator heeft drie instellingen die wijzigen hoe de indicator het kanaal uitzet. Het eerste type kanaal dat wordt geplot, is een basis lineair regressiekanaal. Het zet drie rechte lijnen uit. De middelste lijn vertegenwoordigt de gemiddelde prijs of de mediaan van het bereik. De bovenste en onderste lijnen vertegenwoordigen de bovenste en onderste uitersten van de prijsklasse, waardoor de indicator ongeveer 95% van de prijspunten binnen het prijskanaal zou kunnen dekken.
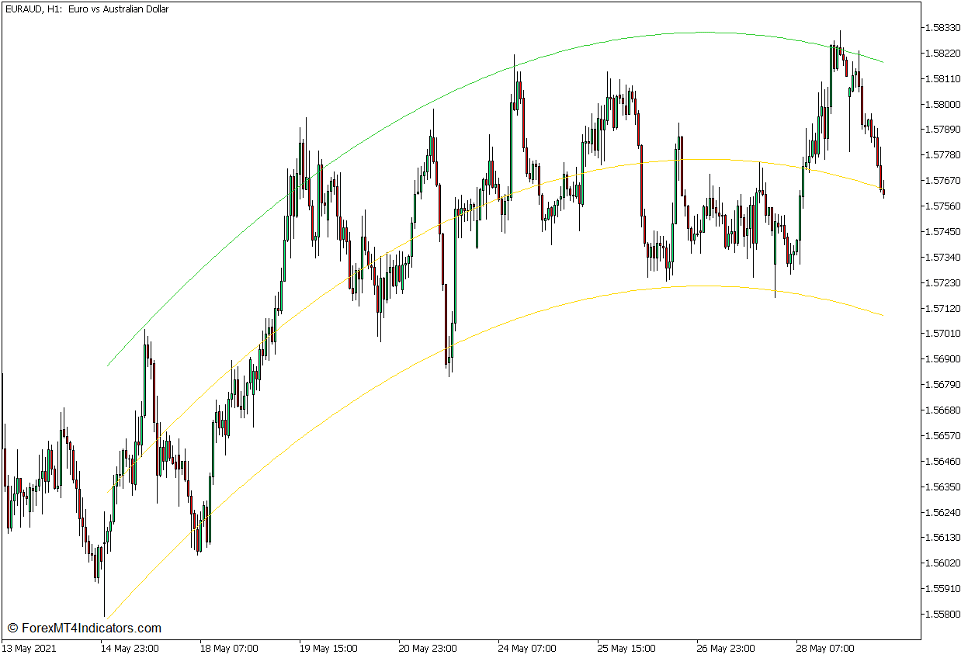
Het volgende type kanaal dat wordt geplot, is een parabolisch type kanaal. Het gebruikt een formule die ervoor zorgt dat de indicator een kanaal uitzet dat eenmaal zou buigen. Hierdoor kunnen gebruikers gemakkelijk de verandering van het traject van prijsactie identificeren.
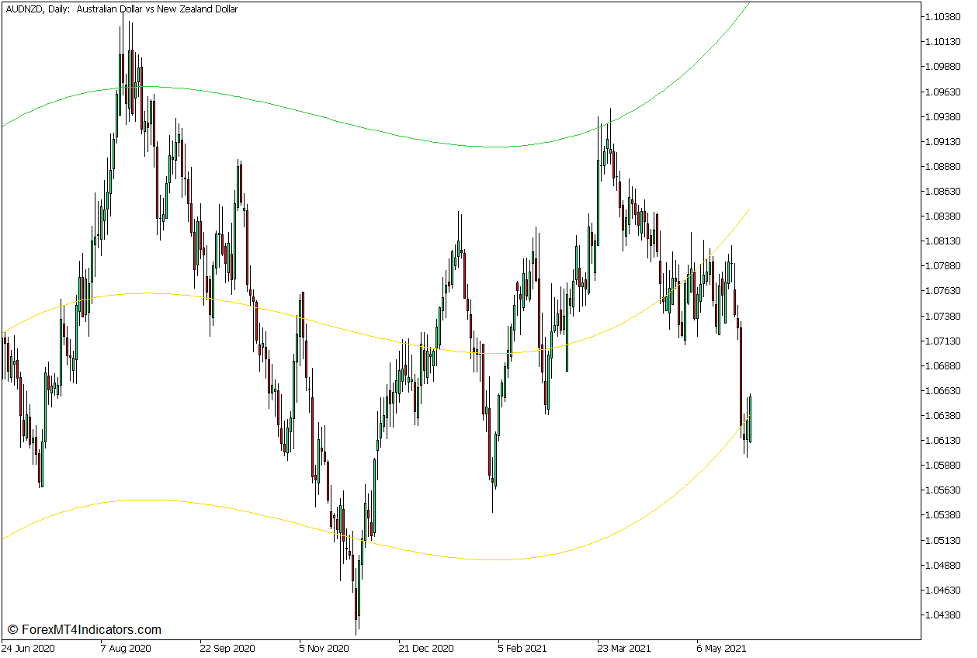
Het laatste type kanaal dat deze indicator uitzet, is er een die een kubieke formule gebruikt. Hierdoor kan de indicator een kanaal plotten dat op twee punten zou buigen. Dit zorgt voor een nauwkeurigere identificatie van het traject van prijsactie.
Pin Bar-kaarsen en prijsafwijzing
Kandelaarpatronen zijn waarschijnlijk een van de ruwste en meest directe signalen die handelaren kunnen gebruiken. Dit komt omdat kandelaarpatronen een verhaal vertellen dat de richting aangeeft die de markt kan inslaan. Vooral omkeringskandelaarpatronen zijn veelbetekenende tekenen van prijsafwijzing en een waarschijnlijke omkering van het momentum.
Het Pin Bar-patroon is waarschijnlijk een van de meest basale maar effectieve momentum-omkeringskandelaarpatronen die handelaren kunnen gebruiken. Het is een eenvoudig kandelaarpatroon dat uit slechts één kaars bestaat. Het wordt geïdentificeerd als een kaars met een opvallend klein lichaam met een lange pit aan het ene uiteinde en een kleine pit aan het andere uiteinde. De richting kan worden bepaald op basis van de positie van de lange pit ten opzichte van zijn lichaam. Als de lange lont zich onder zijn lichaam bevindt, zou de kaars worden geïdentificeerd als een bullish pin bar-kaars. Aan de andere kant, als de lange pit zich boven zijn lichaam bevindt, geeft de kaars een waarschijnlijke bearish omkering aan.
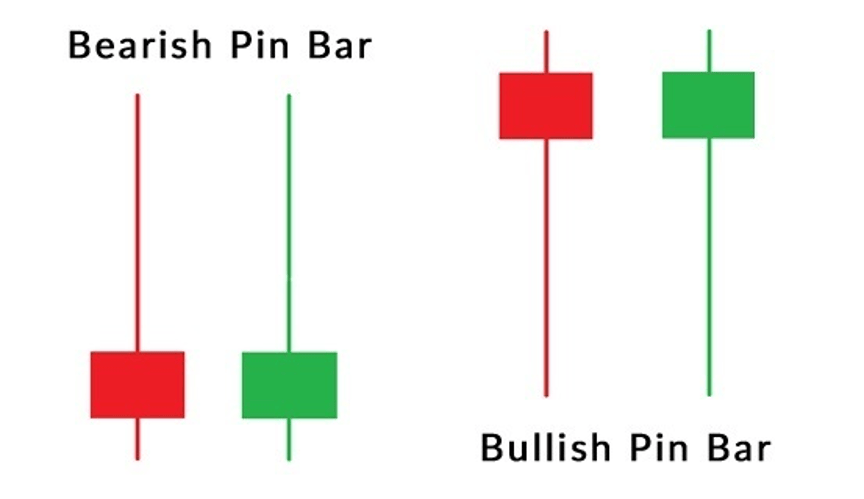
Het Pin Bar-patroon is een veelbetekenend teken van een waarschijnlijke momentumomkering, omdat het ons een verhaal vertelt over prijsafwijzing. Het vertelt ons dat de markt zich niet op zijn gemak voelt bij een bepaald prijsniveau en dat de markt het daarom snel zou afwijzen. Daarom zou de markt zich snel herstellen tegen zijn hoge of lage prijs en sluiten aan de andere kant, wat resulteert in een kaars met een lange pit. en een klein lichaam.
Handelsstrategieconcept
i-Regression Parabolische mediaanbreuk Forex-handelsstrategie voor MT5 is een eenvoudige op kanalen gebaseerde handelsstrategie die handelssignalen levert wanneer de prijs het gemiddelde van het kanaal overschrijdt. Het gebruikt de i-Regressie-indicator om handelaren te helpen het prijskanaal objectief te identificeren. In het bijzonder zouden we het parabolische type kanaal gebruiken. Hierdoor kunnen we de richting van prijsactie observeren, evenals het traject van de trend.
Het eerste criterium waaraan moet worden voldaan, is een sterke cross-over tussen prijs en de middenlijn van het parabolische i-Regression-kanaal. Dit duidt op een verschuiving in de richting van momentum. We zullen echter niet alleen handelen op basis van de cross-over tussen prijs en de mediaan van het kanaal. We zullen toestaan dat de prijs zich terugtrekt naar de middenlijn. We zouden dan letten op tekenen van prijsafwijzing in het gebied rond de middellijn. Dit zou worden geïdentificeerd door een pin-bar-kaars die tegen de middelste lijn van het kanaal duwt.
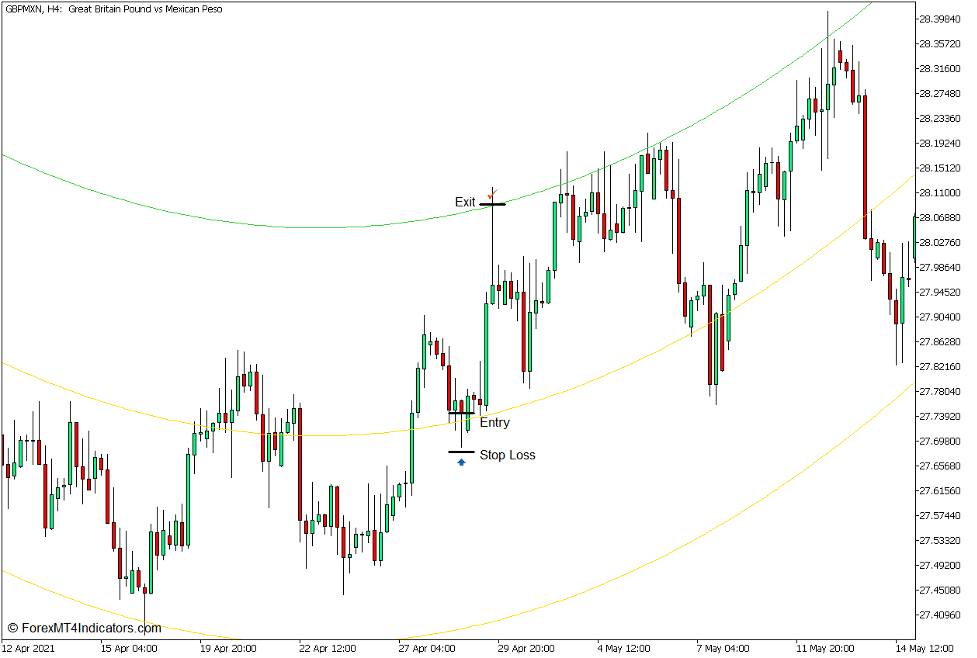
Koop Trade Setup
binnenkomst
- De prijs zou met een sterk momentum boven de middellijn van het i-Regression-kanaal moeten komen.
- Laat de prijs terugtrekken naar de middenlijn van het kanaal.
- Open een kooporder zodra een bullish pin-bar-kaars wordt geïdentificeerd, wat wijst op een prijsafwijzing van het gebied.
Stop Loss
- Stel de stop loss in onder de instapkaars.
afrit
- Sluit de transactie zodra de prijs de bovenste regel van het i-Regression-kanaal raakt.
Verkoop handelsconfiguratie
binnenkomst
- De prijs zou met een sterk momentum onder de middellijn van het i-Regression-kanaal moeten komen.
- Laat de prijs terugtrekken naar de middenlijn van het kanaal.
- Open een verkooporder zodra een bearish pin-bar-kaars wordt geïdentificeerd, wat wijst op een prijsafwijzing van het gebied.
Stop Loss
- Stel de stop loss in boven de instapkaars.
afrit
- Sluit de transactie zodra de prijs de onderste regel van het i-Regression-kanaal raakt.

Conclusie
Op kanalen gebaseerde handel is een van de meest elementaire handelsstrategieën die handelaren kunnen gebruiken. De meeste handelaren zouden dit doen door trendlijnen uit te zetten op basis van prijsactie. Deze methode kan echter subjectief zijn. Aan de andere kant stelt de hierboven genoemde strategie handelaren in staat om de kanalen objectief te identificeren met behulp van de i-Regression Indicator.
Een variatie op deze strategie zou zijn om te handelen op prijsafwijzingen die zich op de bovenste of onderste lijn van het kanaal vormen. Dit kan zorgen voor hogere opbrengsten op basis van risico-rendement.
Handelaren die deze strategie zouden gebruiken, zouden prijsactie moeten leren lezen, aangezien dit de fundamentele basis is van de handelssignalen.
Aanbevolen MT5-makelaars
XM-makelaar
- Gratis $ 50 Om direct te beginnen met handelen! (opneembare winst)
- Stortingsbonus tot $5,000
- Onbeperkt loyaliteitsprogramma
- Bekroonde Forex Broker
- Extra exclusieve bonussen Door het jaar heen

>> Meld u hier aan voor een XM Broker-account <
FBS-makelaar
- Handel 100 Bonus: Gratis $ 100 om uw handelsreis een vliegende start te geven!
- 100% Deposit Bonus: Verdubbel uw storting tot $10,000 en handel met meer kapitaal.
- Gebruik maximaal 1: 3000: Maximaliseren van potentiële winsten met een van de hoogste beschikbare hefboomopties.
- Award voor 'Beste Klantenservicemakelaar Azië': Erkende uitmuntendheid op het gebied van klantenondersteuning en service.
- Seizoensgebonden promoties: Geniet het hele jaar door van een verscheidenheid aan exclusieve bonussen en promotie-aanbiedingen.

>> Meld u hier aan voor een FBS-brokeraccount <
Klik hieronder om te downloaden: