


Trendomkeringen zijn enkele van de meest winstgevende handelsscenario's waarvan handelaren zouden kunnen profiteren. Markten die trending zijn, hebben de neiging om vrij lang in één richting door te gaan. Hierdoor kunnen handelaren die aan het begin van de trend konden anticiperen op de trendomkering, enorm profiteren van een dergelijke transactie. Winsten kunnen hoog oplopen als pips in de richting van de transactie van de trendomkeerhandelaar bewegen.
Hoewel omkeringen van handelstrends een heel goed idee lijken, is het vaak makkelijker gezegd dan gedaan. Dit komt omdat trendomkeringen erg moeilijk te anticiperen zijn. Vaak beschouwen handelaren diepe retracements ten onrechte als een trendomkeringssignaal, waardoor ze tegen de richting van een sterk heersende trend in handelen.
Wat handelaren nodig hebben om veel te profiteren van trendomkeringen, is een logische en systematische methode om op trendomkeringen te anticiperen.
Een van de beste manieren om op een trendomkering te anticiperen, is door cross-overs van voortschrijdende gemiddelden te gebruiken. Met de juiste parameters en handelsinstellingen kunnen cross-overs met voortschrijdend gemiddelde systematisch potentiële trendomkeringen lokaliseren op basis van het overschrijden van een lijn met voortschrijdend gemiddelde over een lijn met vertragend voortschrijdend gemiddelde. Niet alle cross-overs met voortschrijdend gemiddelde zouden echter werken. Sommige opstellingen zijn beter dan andere. Er zijn ook gevallen waarin gewijzigde voortschrijdende gemiddelden en aangepaste technische indicatoren worden gebruikt.
Donchian-kanalen
The Donchian Channels is een op bands gebaseerde trendvolgende technische indicator ontwikkeld door Richard Donchian.
Het wordt gevormd door de hoogste en laagste prijsactie te nemen binnen een bepaalde periode of een bepaald aantal kaarsen. De middellijn van het Donchian Channel wordt uitgezet op basis van de mediaan van het gespecificeerde bereik. De hoogste hoge en laagste lage van dezelfde prijsklasse wordt ook gemarkeerd door de bovenste en onderste banden van het Donchian Channel.
Het Donchian Channel kan net als de andere band- of kanaalgebaseerde technische indicatoren worden gebruikt. Een prijs die boven of onder de bovenste en onderste banden doorbreekt, kan wijzen op een mogelijke uitbraak van het momentum. Prijsactie die tekenen van afwijzing op het genoemde gebied vertoont, kan ook wijzen op een mogelijke gemiddelde omkering.
De middellijn van het Donchian Channel kan ook worden gebruikt, net als andere lijnen met voortschrijdend gemiddelde. Het kan worden gebruikt om de richting van de trend te identificeren op basis van de algemene locatie van prijsactie in relatie daarmee.
Driehoekig voortschrijdend gemiddelde
Het driehoekige voortschrijdend gemiddelde (TMA) is een aangepaste versie van de standaard voortschrijdend gemiddelde lijn.
Voortschrijdende gemiddelden zijn een van de meest gebruikte trendvolgende technische indicatoren. Door de eenvoud en effectiviteit kunnen handelaren gemakkelijk de richting van een trend ontcijferen. Traders kunnen de trendrichting identificeren op basis van de algemene locatie van de prijsactie ten opzichte van een lijn met voortschrijdend gemiddelde, evenals de richting van de helling van de lijn.
Ondanks de eenvoud en effectiviteit zijn voortschrijdende gemiddelden vatbaar voor valse signalen die vaak voorkomen tijdens bereikgebonden markten.
Driehoekig voortschrijdend gemiddelde probeert dit aan te pakken door de voortschrijdend gemiddelde lijn glad te strijken op basis van een gewijzigde berekening. In feite maakt de TMA-dubbel de lijn van het voortschrijdend gemiddelde glad. Dit creëert een lijn die stabieler is, waardoor deze minder vatbaar is voor valse signalen.
Relative Strength Index
De Relative Strength Index (RSI) is een klassieke technische momentumindicator die wordt uitgezet als een oscillator.
De RSI zet een lijn uit die oscilleert binnen het bereik van 0 tot 100 met een middelpunt op 50. Een RSI-lijn die boven de 50 blijft, duidt op een bullish trendbias, terwijl een RSI-lijn die onder de 50 blijft een bearish trendbias aangeeft.
Het heeft meestal ook markeringen op niveau 30 en 70. Een RSI-lijn boven de 70 terwijl prijsactie tekenen van een bearish omkering vertoont, kan erop duiden dat de prijs overbought is en aan een gemiddelde omkering toe is. Aan de andere kant kan een RSI-lijn onder de 30, terwijl prijsactie een bullish omkering aangeeft, betekenen dat de prijs oververkocht is en toe is aan een bullish mean omkering.
Momentumhandelaren daarentegen zien doorbraken boven de 70 en dalen onder de 30 als een indicatie van een sterk momentum. Het komt allemaal neer op de kenmerken van prijsactie tijdens deze omstandigheden, of prijsactie nu tekenen van ommekeer vertoont of een sterke uitbraak van het momentum.
Sommige handelaren voegen niveau 45 en 55 toe aan de prijsgrafiek om trending markten te bevestigen. Level 45 fungeert als ondersteuningsniveau tijdens een bullish trend. Level 55 fungeert als weerstandsniveau tijdens een bearish trend.
Trading strategie
Donchian MA Crossover Forex Trading Strategy is een eenvoudige trendomkeerstrategie die is gebaseerd op de kruising van twee trendvolgende technische indicatoren.
Opstellingen voor trendomkering worden geïdentificeerd op basis van de kruising van de middellijn van het Donchian Channel en de TMA-lijn.
De trendomkering zou dan moeten worden bevestigd door de RSI-lijn die boven de 55 komt in een bullish trend of onder de 45 zakt in een bearish trend. De lijn zou dan niveau 45 respecteren als ondersteuning in een bullish trend of 55 als weerstand in een bearish trend als de handelsopzet zich ontwikkelt tot een trend.
Momentum wordt ook bevestigd op basis van prijsafsluiting buiten het Donchian Channel.
Indicatoren:
- Donchiaanse bands
- TMA
- Periodes: 36
- Relative Strength Index
- Periode: 19
Voorkeurstermijnen: 30 minuten, 1 uur, 4 uur en dagelijkse grafieken
Valutaparen: FX majors, minors en crosses
Handelssessies: Sessies Tokio, Londen en New York
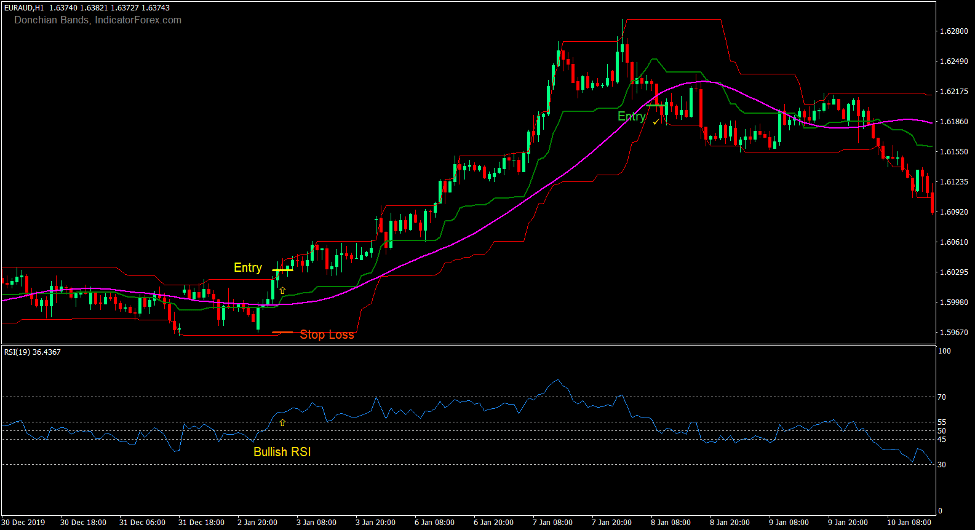
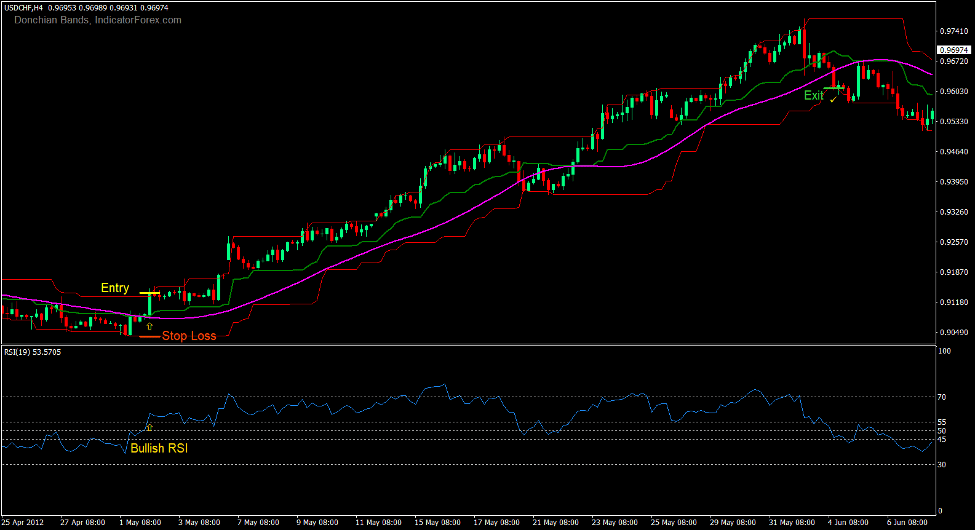
Koop Trade Setup
binnenkomst
- De middellijn van de Donchian Channels zou boven de TMA-lijn moeten komen.
- De RSI-lijn moet boven 55 kruisen.
- Een bullish kaars zou moeten sluiten boven de bovenste lijn van het Donchian Channel.
- Voer een kooporder in bij de bevestiging van deze voorwaarden.
Stop Loss
- Stel de stop loss in op een steun onder de instapkaars.
afrit
- Sluit de transactie zodra de prijs onder de onderste lijn van het Donchian Channel sluit.
- Sluit de transactie zodra de middellijn van het Donchian Channel onder de TMA-lijn komt.
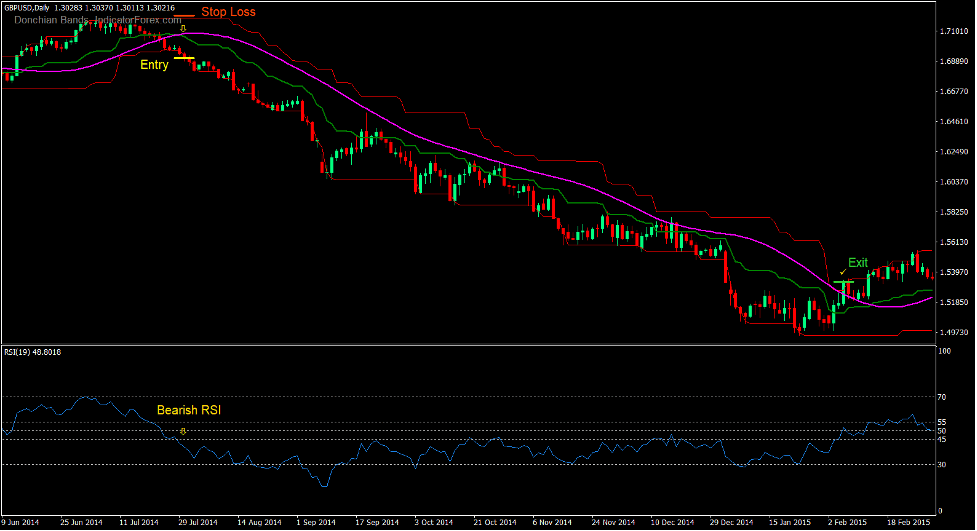
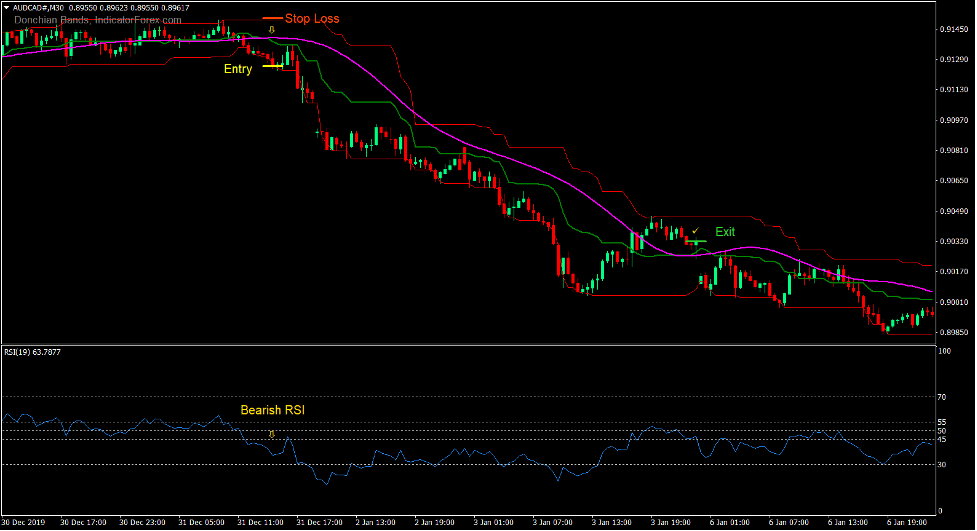
Verkoop handelsconfiguratie
binnenkomst
- De middellijn van de Donchian-kanalen moet onder de TMA-lijn komen.
- De RSI-lijn moet onder de 45 komen.
- Een bearish kaars zou moeten sluiten onder de onderste lijn van het Donchian Channel.
- Voer een verkooporder in bij de bevestiging van deze voorwaarden.
Stop Loss
- Stel de stop loss in op een weerstand boven de instapkaars.
afrit
- Sluit de transactie zodra de prijs boven de bovenste lijn van het Donchian Channel sluit.
- Sluit de transactie zodra de middellijn van het Donchian Channel boven de TMA-lijn komt.
Conclusie
Deze handelsstrategie is een eenvoudige trendomkeerstrategie die heel goed zou kunnen werken in de juiste marktomstandigheden. Het is zeer effectief in markten die een sterke neiging hebben om sterk om te keren en diepe prijsschommelingen hebben.
Het is ook het beste om deze strategie te verhandelen in combinatie met actiescenario's voor momentumuitbraakprijzen.
Aanbevolen MT4-makelaars
XM-makelaar
- Gratis $ 50 Om direct te beginnen met handelen! (opneembare winst)
- Stortingsbonus tot $5,000
- Onbeperkt loyaliteitsprogramma
- Bekroonde Forex Broker
- Extra exclusieve bonussen Door het jaar heen

>> Meld u hier aan voor een XM Broker-account <
FBS-makelaar
- Handel 100 Bonus: Gratis $ 100 om uw handelsreis een vliegende start te geven!
- 100% Deposit Bonus: Verdubbel uw storting tot $10,000 en handel met meer kapitaal.
- Gebruik maximaal 1: 3000: Maximaliseren van potentiële winsten met een van de hoogste beschikbare hefboomopties.
- Award voor 'Beste Klantenservicemakelaar Azië': Erkende uitmuntendheid op het gebied van klantenondersteuning en service.
- Seizoensgebonden promoties: Geniet het hele jaar door van een verscheidenheid aan exclusieve bonussen en promotie-aanbiedingen.

>> Meld u hier aan voor een FBS-brokeraccount <
Klik hieronder om te downloaden: