


Veel handelaren hebben een competitief karakter. Als zodanig zouden de meeste handelaren streven naar perfectie. Ze zouden op zoek gaan naar de perfecte strategie, een die hen nooit zou laten verliezen. Ze zouden zich aangetrokken voelen tot ambitieuze strategieën die beweren een winstpercentage van 90% of zelfs meer te hebben. Sommigen zouden naar hedgingstrategieën kijken die hen nooit zouden moeten laten verliezen, wat mogelijk is maar zeer riskant is.
Wat veel nieuwe handelaren niet begrijpen, is dat handelen draait om kansen. Het gaat niet om het hebben van een perfecte strategie die u nooit een cent mag laten verliezen. Het gaat niet om het vinden van de heilige graal van de handel. Het gaat er eerder om de wet van de grote getallen in uw voordeel te laten werken. Het gaat erom de wet van waarschijnlijkheden in uw voordeel te laten werken.
Een van de manieren waarop handelaren een opstelling vinden met een hoge winstkans, is door te zoeken naar samenvloeiingen. Het is wanneer meerdere factoren in dezelfde richting wijzen dat veel handelaren dezelfde handelsrichting zouden volgen, hoewel met verschillende hypothesen. Hoewel de reden voor het nemen van de transactie anders kan zijn, lijken de resultaten vaak een self-fulfilling prophecy. Naarmate handelaren de handel in dezelfde richting volgen, bouwt het momentum op waardoor de prijs de handelsinstellingen bevestigt.
DiDi Index Crossover Forex Trading Strategy is een eenvoudige handelsstrategie die is gebaseerd op samenvloeiingen. Het creëert handelsconfiguraties op basis van indicatoren die ook gebaseerd zijn op samenvloeiingen. Het maakt ook gebruik van indicatoren die complementair zijn, waardoor handelaren beslissende handelsbeslissingen kunnen nemen op basis van een zeer waarschijnlijke handelsconfiguratie.
DiDi-index
DiDi Index is een trendvolgende indicator die is afgeleid van gewijzigde voortschrijdende gemiddelden. Het baseert zijn plotten van zijn oscillatorlijnen op de crossover van drie voortschrijdend gemiddelde lijnen. Handelaren kunnen de indicator wijzigen door de lengte van de onderliggende voortschrijdende gemiddelden te wijzigen op het tabblad "Inputs".
Het is een indicator van het oscillatortype die twee lijnen op zijn eigen venster uitzet. Deze twee lijnen kunnen oscilleren van positief naar negatief en vice versa. De blauwe lijn van de ontwijker vertegenwoordigt de sneller bewegende lijn, terwijl de rode lijn de langzamere lijn vertegenwoordigt.
Trendrichting is eenvoudig gebaseerd op hoe de twee oscillatorlijnen elkaar overlappen. Als de blauwe lijn van de ontwijker zich boven de rode lijn bevindt, wordt de trend als bullish beschouwd. Aan de andere kant, als de blauwe lijn van de ontwijker onder de rode lijn ligt, wordt de trend als bearish beschouwd. Als zodanig worden trendomkeringssignalen gegenereerd wanneer de twee lijnen elkaar kruisen.
Indicatorpijlen
De indicatorpijlen is een trendomkeringssignaalindicator die is gebaseerd op de samenvloeiing van meerdere onderliggende indicatoren.
De onderliggende indicatoren zijn de voortschrijdende gemiddelden, voortschrijdend gemiddelde convergentie en divergentie (MACD), voortschrijdend gemiddelde van oscillator (OsMA), Stochastic Oscillator, Relative Strength Index (RSI), Commodity Channel Index (RSI), Average Directional Movement Index (ADX), en Relatieve Kracht Index (RVI).
Aangezien deze indicator is gebaseerd op de samenvloeiing van een verscheidenheid aan veelgebruikte technische indicatoren, moeten de signalen die hij produceert zeer betrouwbaar zijn. Op basis van hoe de signalen worden geplot, lijkt deze indicator veelbelovend. Het kan specifieke punten op de grafiek aanwijzen waar de prijs is omgekeerd. Het lijkt zeer waarschijnlijke trendomkeringssignalen te produceren.
Het geeft potentiële trendomkeringspunten aan door een pijl uit te zetten die de richting van de trendomkering aangeeft.
Trading strategie
Deze handelsstrategie handelt op samenvloeiingen tussen de DiDi-index en de indicatorpijlen, terwijl het tegelijkertijd is afgestemd op de langetermijntrend.
Om de langetermijntrend te identificeren, gebruiken we het exponentieel voortschrijdend gemiddelde over 200 perioden (EMA). Trendrichting zal gebaseerd zijn op de algemene locatie van prijsactie ten opzichte van de 200 EMA-lijn, evenals de helling van de 200 EMA-lijn. Prijsactie zou ook de trendrichting moeten bevestigen op basis van het patroon van de swingpunten. Signalen worden alleen als geldig beschouwd als ze in lijn zijn met de langetermijntrend.
Zodra de langetermijntrend is geïdentificeerd, kunnen we nu geldige signalen identificeren op basis van de samenvloeiing van de DiDi-index en de indicatorpijlen. Op de DiDi-index zijn signalen eenvoudig gebaseerd op de crossover van de blauwe en rode lijnen van de dodger. Op de indicatorpijlen zijn signalen eenvoudig gebaseerd op een pijl die wordt geplot. Deze signalen moeten nauw op elkaar worden afgestemd om als geldig te worden beschouwd.
Indicatoren:
- 200 EMA
- Indicatorpijlen
- DiDi_Index
Voorkeurstermijnen: 1-uur-, 4-uur- en daggrafieken
Valutaparen: FX majors, minors en crosses
Handelssessies: Sessies Tokio, Londen en New York
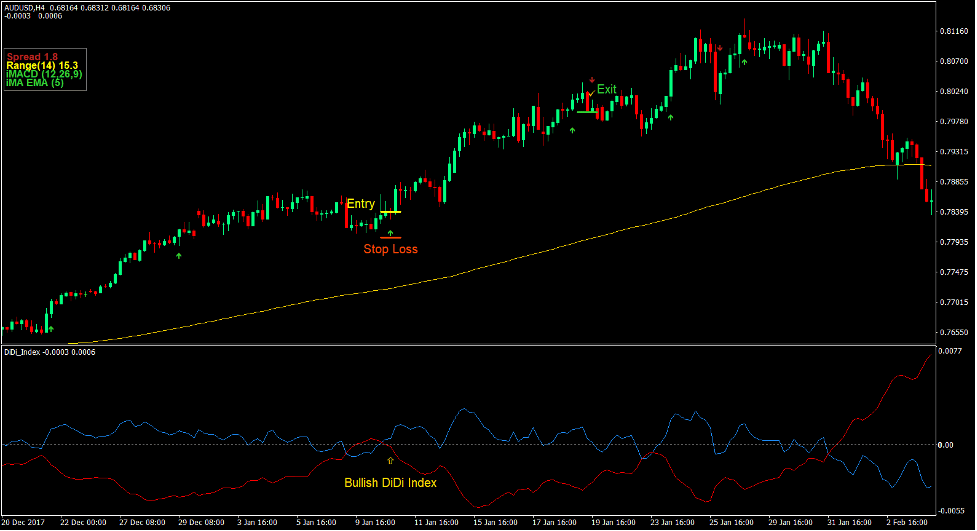
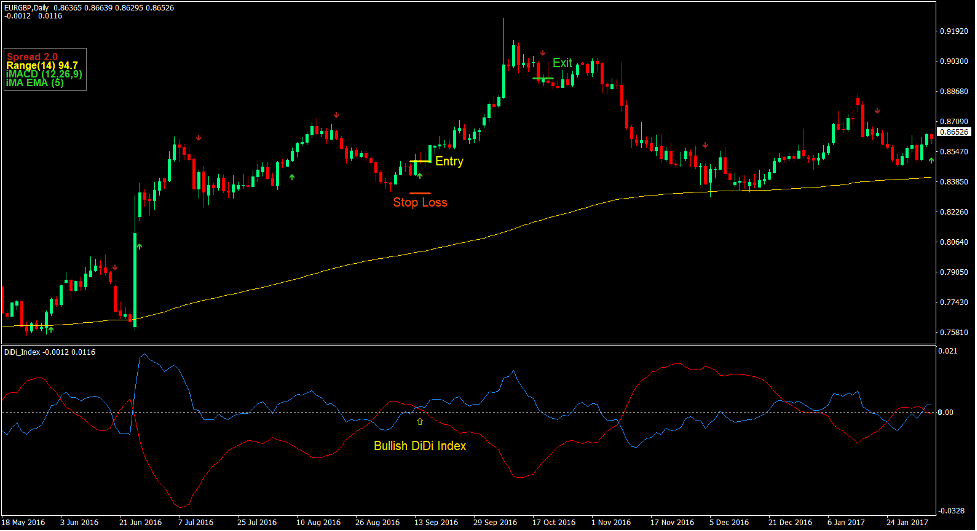
Koop Trade Setup
binnenkomst
- Prijsactie moet boven de 200 EMA-lijn liggen.
- De 200 EMA-lijn zou omhoog moeten lopen.
- Swingpoints voor prijsacties zouden een stijgend patroon moeten vormen.
- De dodger blauwe lijn van de DiDi Index moet boven de rode lijn uitkomen.
- De indicatorpijlen moeten een pijl naar boven weergeven.
- Voer een kooporder in bij de bevestiging van deze voorwaarden.
Stop Loss
- Stel de stop loss in op de steun onder de instapkaars.
afrit
- Sluit de transactie zodra de indicatorpijlen een naar beneden wijzende pijl plotten.
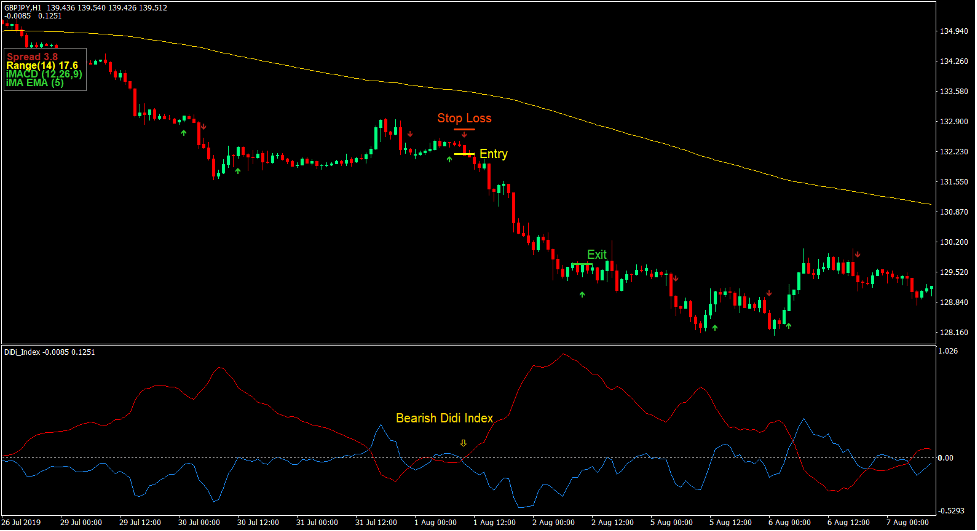
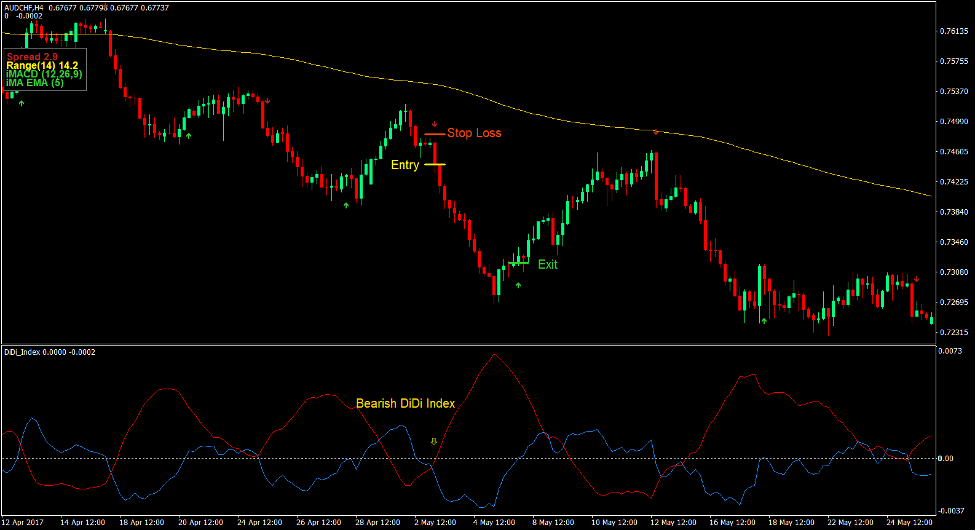
Verkoop handelsconfiguratie
binnenkomst
- Prijsactie moet onder de 200 EMA-lijn liggen.
- De 200 EMA-lijn moet naar beneden hellen.
- Prijsactie-zwaaipunten moeten een dalend patroon vormen.
- De blauwe lijn van de ontwijker van de DiDi Index moet onder de rode lijn kruisen.
- De indicatorpijlen moeten een pijl naar beneden weergeven.
- Voer een verkooporder in bij de bevestiging van deze voorwaarden.
Stop Loss
- Stel de stop loss in op de weerstand boven de instapkaars.
afrit
- Sluit de transactie zodra de indicatorpijlen een pijl naar boven tonen.
Conclusie
Deze handelsstrategie is een zeer waarschijnlijke handelsstrategie. Wanneer het in de juiste marktomstandigheden wordt gebruikt, heeft het de neiging om handelsconfiguraties te produceren met een zeer grote kans om te resulteren in een winnende transactie.
Het combineert ook langetermijntrends met retracements op de middellange termijn en trendomkeringen. Deze instellingen kunnen meerdere keren voorkomen in een trend. Als de geproduceerde signalen zich echter laat in een langetermijntrend bevinden, is de kans groter dat de trend daadwerkelijk wordt omgekeerd.
Handelaren moeten de balans vinden tussen het identificeren van duidelijk vastgestelde trends en het nemen van handelsconfiguraties die niet te laat in een trend zijn. Handelaren die dit kunnen, kunnen deze strategie gebruiken om consequent van de markt te profiteren.
Aanbevolen MT4-makelaars
XM-makelaar
- Gratis $ 50 Om direct te beginnen met handelen! (opneembare winst)
- Stortingsbonus tot $5,000
- Onbeperkt loyaliteitsprogramma
- Bekroonde Forex Broker
- Extra exclusieve bonussen Door het jaar heen

>> Meld u hier aan voor een XM Broker-account <
FBS-makelaar
- Handel 100 Bonus: Gratis $ 100 om uw handelsreis een vliegende start te geven!
- 100% Deposit Bonus: Verdubbel uw storting tot $10,000 en handel met meer kapitaal.
- Gebruik maximaal 1: 3000: Maximaliseren van potentiële winsten met een van de hoogste beschikbare hefboomopties.
- Award voor 'Beste Klantenservicemakelaar Azië': Erkende uitmuntendheid op het gebied van klantenondersteuning en service.
- Seizoensgebonden promoties: Geniet het hele jaar door van een verscheidenheid aan exclusieve bonussen en promotie-aanbiedingen.

>> Meld u hier aan voor een FBS-brokeraccount <
Klik hieronder om te downloaden: