


Momentum-uitbarstingen zijn een soort marktconditie waarbij de prijs sterk in één richting beweegt, meestal binnen een paar kaarsen en soms zelfs begon met slechts één prijskaars. Deze kaarsen breken vaak een fase van marktcontractie uit, die meestal wordt gekenmerkt door lage prijs, besluiteloze prijskaarsen. De plotselinge verschijning van een lange, volle kaars geeft aan dat er een marktgebeurtenis heeft plaatsgevonden die ervoor zorgde dat handelaren onmiddellijk kochten of verkochten.
Momentumuitbraken hebben zoveel potentieel. Dit komt omdat momentumuitbarstingen vaak het begin zijn van een nieuwe trend. Traders die deze nieuwe trends konden opvangen en er tot het einde mee door konden gaan, konden enorme opbrengsten verdienen in een enkele transactie.
Momentumtraders hebben echter ook de neiging om op prijs te jagen als de markt in een bepaalde richting beweegt. Momentumtraders hebben een systematische momentumhandelsstrategie nodig die hen in staat zou moeten stellen objectief een goed momentumuitbraaksignaal te identificeren dat zou kunnen resulteren in een nieuwe trend.
Bollinger Bands
De Bollinger Bands is een van de meest veelzijdige technische indicatoren. Het is een trendvolgende technische indicator, die handelaren ook informatie geeft over volatiliteit en die ook kan worden gebruikt om gemiddelde omkeringen en momentumuitbraken te identificeren.
De Bollinger Bands-indicator bestaat uit drie lijnen.
De middelste lijn is een SMA-lijn (Simple Moving Average) met 20 perioden. Als zodanig kunnen handelaren het gebruiken als trendindicator. Trendrichting kan worden geïdentificeerd op basis van de helling van de middelste lijn, evenals de algemene locatie van prijsactie ten opzichte van de lijn. Trendomkeersignalen kunnen ook worden geïdentificeerd op basis van de kruising van prijsactie en de middellijn.
De twee buitenste lijnen zijn in feite standaardafwijkingen van de middelste lijn. Deze lijnen zijn meestal ingesteld op twee standaarddeviaties verschoven boven en onder de middelste lijn.
Aangezien de buitenste lijnen zijn gebaseerd op een standaarddeviatie, kunnen de Bollinger Bands worden gebruikt om de volatiliteit te identificeren. Uitbreidende banden duiden op een groeiende marktfase, terwijl samentrekkende banden een krimpende marktfase aangeven.
Mean reversal traders gebruiken de Bollinger Bands ook om waarschijnlijke mean reversals van overbought of oversold prijscondities te identificeren. Het gebied buiten de buitenste lijnen wordt beschouwd als oververkochte en overboughtgebieden. Prijskaarsen die buiten de lijn tekenen van prijsafwijzing vertonen, kunnen erop duiden dat de prijs ofwel overbought of oversold is en dat deze snel kan omslaan.
Momentumhandelaren daarentegen gebruiken de buitenste lijnen als basis voor een momentumuitbraak. Sterke momentumkaarsen die buiten de Bollinger Bands breken, kunnen worden geïnterpreteerd als een momentumuitbraak die voortkomt uit een marktcontractiefase.
Exponentiële voortschrijdende gemiddelden signalen
Een van de meest populaire manieren waarop traders potentiële trendomkeringen identificeren, is gebaseerd op de cross-over van lijnen met voortschrijdend gemiddelde. Met de juiste parameters en bij gebruik in de juiste marktomstandigheden kunnen voortschrijdend gemiddelde crossover-signalen zeer effectief zijn.
Exponential Moving Averages Signals is gebaseerd op dit concept. Het plot pijlen wanneer het zijn onderliggende voortschrijdend gemiddelde lijnen kruist. De richting waarin de pijl wijst, geeft de richting van de trend aan.
Deze indicator maakt gebruik van exponentiële voortschrijdende gemiddelden (EMA) omdat dit type lijn met voortschrijdend gemiddelde de neiging heeft zeer snel te reageren op prijsbewegingen, waardoor het ideaal is voor trendomkeringssignalen.
Coppock-indicator
De Coppock-indicator is een aangepaste technische indicator die wordt gebruikt om handelaren te helpen trendrichtingen te identificeren. Het is een indicator van het oscillatortype die histogrambalken uitzet om de trendrichting aan te geven.
Deze indicator plot histogrambalken die oscilleren rond de mediaan, nul. Positieve balken geven een bullish trendbias aan, terwijl negatieve balken een bearish trendbias aangeven.
Hoewel de parameters kunnen worden aangepast aan de handelsstijl van de handelaar, is het natuurlijk geschikt om langetermijntrends aan te geven.
Traders kunnen het verschuiven van de balken naar positief of negatief gebruiken om een mogelijke trendomkering aan te geven.
Handelaren kunnen de indicator ook gebruiken als trendrichtingfilter om te voorkomen dat transacties worden uitgevoerd die tegen de richting van de trend ingaan.
Trading strategie
Coppock Momentum Trend Forex Trading Strategy is een trendvolgende strategie die wordt geïnitieerd door een momentum-uitbraakscenario.
De Bollinger Bands-indicator wordt gebruikt om de momentumuitbraak te identificeren. Een sterke momentumkaars zou uit de Bollinger Bands moeten breken om een momentumuitbraak aan te geven. Prijsactie moet op de helft van de Bollinger Bands blijven waar de uitbraak heeft plaatsgevonden, wat aangeeft dat het de middellijn respecteert als een dynamische ondersteuning of weerstand.
De signalen van het exponentieel voortschrijdend gemiddelde zouden ook een pijl moeten uitzetten die de richting van de waarschijnlijke trendomkering aangeeft.
Vervolgens zouden de Coppock-balken over nul moeten verschuiven, wat aangeeft dat de trend in de richting van de trend is verschoven.
Indicatoren:
- Bollinger Bands (standaardinstellingen)
- ExponentiëleBewegendeGemiddeldenSignalen
- Snellere EMA: 25
- Langzamere EMA: 30
- Coppok
- R Periode1: 36
Voorkeurstermijnen: Grafieken van 30 minuten, 1 uur en 4 uur
Valutaparen: FX majors, minors en crosses
Handelssessies: Sessies Tokio, Londen en New York
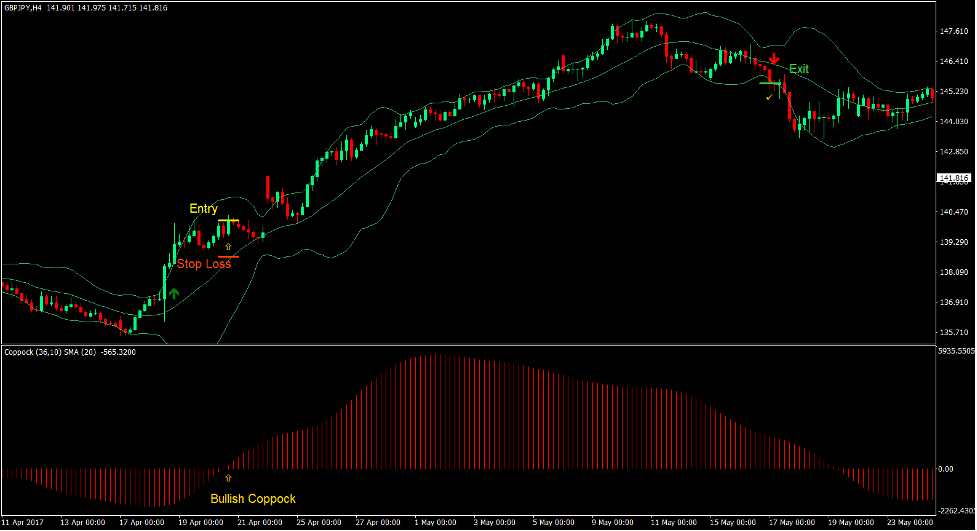
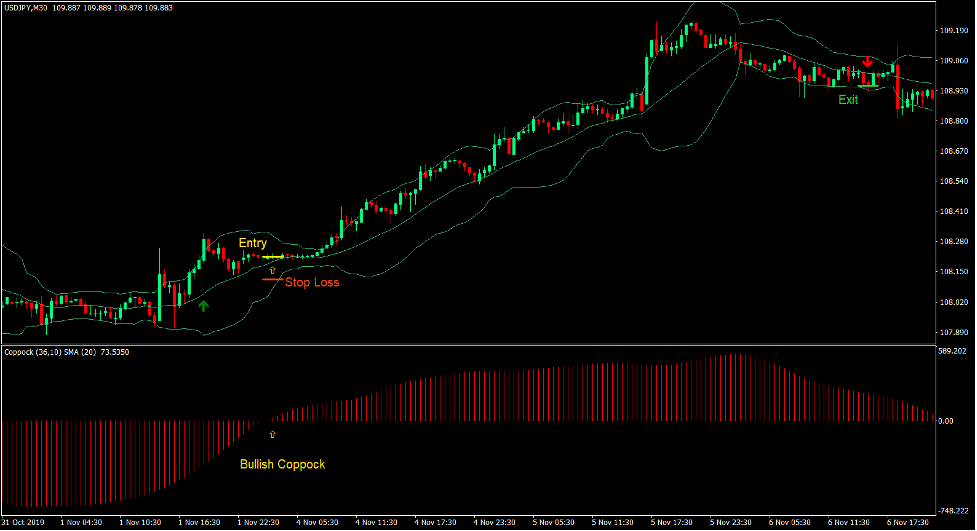
Koop Trade Setup
binnenkomst
- Een bullish momentum-kaars zou moeten breken boven de bovenste lijn van de Bollinger Bands.
- De indicator Exponential Moving Averages Signals zou een pijl moeten uitzetten die omhoog wijst.
- De Coppock-balken moeten boven nul verschuiven.
- Voer een kooporder in bij de bevestiging van deze voorwaarden.
Stop Loss
- Stel de stop loss in op een steun onder de instapkaars.
afrit
- Sluit de transactie zodra een kaars sluit onder de onderste Bollinger Bands-lijn.
- Sluit de handel zodra de exponentiële voortschrijdende gemiddelden signalen indicator een pijl naar beneden uitzet.
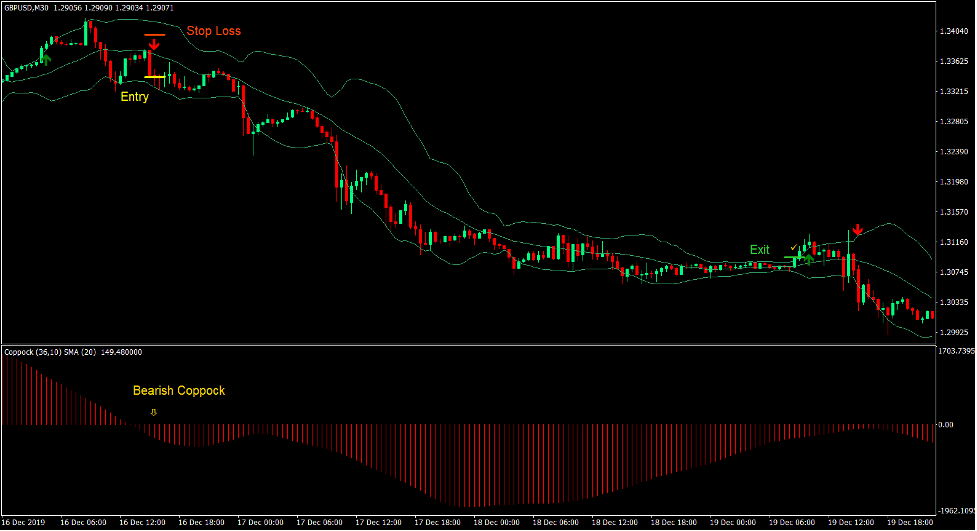
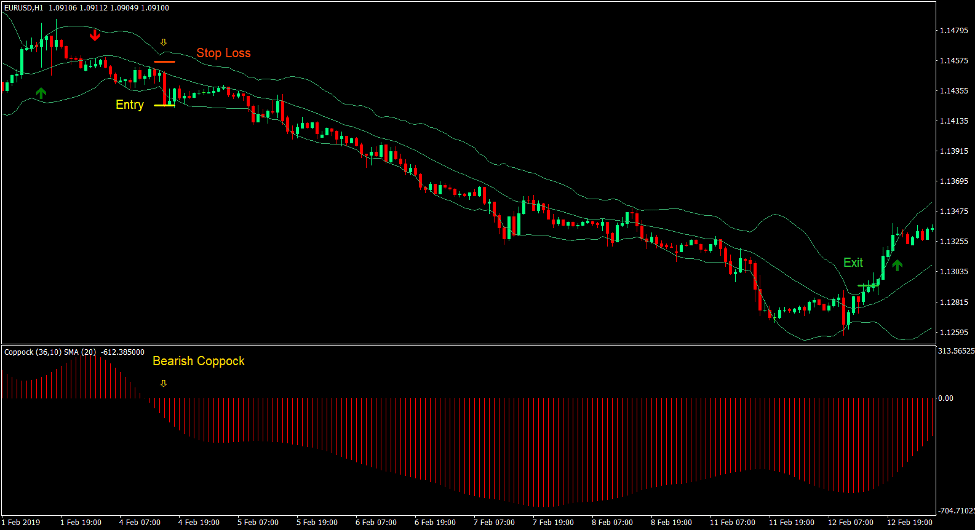
Verkoop handelsconfiguratie
binnenkomst
- Een bearish momentum-kaars zou moeten breken onder de onderste lijn van de Bollinger Bands.
- De indicator Exponential Moving Averages Signals zou een pijl naar beneden moeten uitzetten.
- De Coppock-balken moeten onder nul verschuiven.
- Voer een verkooporder in bij de bevestiging van deze voorwaarden.
Stop Loss
- Stel de stop loss in op een weerstand boven de instapkaars.
afrit
- Sluit de transactie zodra een kaars boven de bovenste Bollinger Bands-lijn sluit.
- Sluit de handel zodra de exponentiële voortschrijdende gemiddelden signalen indicator een pijl naar beneden uitzet.
Conclusie
Deze handelsstrategie kan handelsconfiguraties opleveren met het potentieel om hoogrenderende transacties te produceren. Dit komt omdat momentumuitbraken vaak kunnen resulteren in een trending marktconditie.
De breakout-kaars zelf betekent echter niet dat er een trendomkering op handen is. Er zijn veel voorwaarden waaraan moet worden voldaan. Het kan de verschuiving zijn in de richting van schommelingen in de prijsactie en het opnieuw testen van dynamische ondersteuningen of weerstanden.
Deze handelsstrategie bevestigt systematisch de trendomkering op basis van een reeks regels, waardoor handelaren automatisch transacties kunnen invoeren zonder zichzelf te raden.
Aanbevolen MT4-makelaars
XM-makelaar
- Gratis $ 50 Om direct te beginnen met handelen! (opneembare winst)
- Stortingsbonus tot $5,000
- Onbeperkt loyaliteitsprogramma
- Bekroonde Forex Broker
- Extra exclusieve bonussen Door het jaar heen

>> Meld u hier aan voor een XM Broker-account <
FBS-makelaar
- Handel 100 Bonus: Gratis $ 100 om uw handelsreis een vliegende start te geven!
- 100% Deposit Bonus: Verdubbel uw storting tot $10,000 en handel met meer kapitaal.
- Gebruik maximaal 1: 3000: Maximaliseren van potentiële winsten met een van de hoogste beschikbare hefboomopties.
- Award voor 'Beste Klantenservicemakelaar Azië': Erkende uitmuntendheid op het gebied van klantenondersteuning en service.
- Seizoensgebonden promoties: Geniet het hele jaar door van een verscheidenheid aan exclusieve bonussen en promotie-aanbiedingen.

>> Meld u hier aan voor een FBS-brokeraccount <
Klik hieronder om te downloaden: