


Batang lilin Jepun telah menjadi salah satu inovasi paling revolusioner dalam perdagangan. Di sebalik kesederhanaannya, candlestick Jepun mempunyai begitu banyak impak dalam perdagangan teknikal. Malah, kebanyakan peniaga hari ini menggunakan batang lilin Jepun sebagai gaya carta mereka.
Batang lilin Jepun sangat berkesan sebagai kaedah carta kerana ia memudahkan cara pedagang melihat carta harga mereka, sambil pada masa yang sama menceritakan kisah bagaimana harga bergerak. Carta bar asas mungkin kelihatan seperti pembukaan, penutupan, tinggi dan rendah pergerakan harga yang mudah. Walau bagaimanapun, dengan batang lilin Jepun, carta harga menceritakan kisah bagaimana harga bergerak ke sana ke mari merentasi julat harga.
Kaedah melihat pada batang lilin Jepun dan memahami kisah tentang bagaimana harga bergerak paling baik dirangkumkan dengan corak batang lilin.
Corak candlestick ialah corak berulang yang dibentuk oleh candlestick yang menunjukkan arah tindakan harga seterusnya. Corak ini boleh memberitahu pedagang sama ada harga sedang berbalik atau berterusan. Ia juga boleh memberitahu peniaga jika harga mempunyai momentum atau pasaran tidak pasti. Ia boleh menunjukkan jika harga menolak tahap tertentu atau menembusinya dengan momentum. Semua maklumat ini adalah petunjuk berguna yang mungkin digunakan oleh pedagang untuk menjangka pergerakan harga seterusnya.
Di sini kita akan melihat bagaimana bar pin, yang merupakan salah satu corak candlestick yang paling mudah namun paling popular dan berkesan, boleh dilaksanakan berhubung dengan keadaan pasaran yang sedang berkembang.
Penunjuk Bar Pin
Pin Bar mungkin merupakan salah satu corak candlestick paling mudah yang mungkin ditemui oleh pedagang. Ia adalah lilin yang terdiri daripada badan kecil dengan sumbu yang sangat kecil pada satu hujung dan sumbu panjang di hujung yang lain. Peraturan praktikal yang baik dalam mengenal pasti corak bar pin ialah sumbu panjang hendaklah 2/3 saiz keseluruhan lilin.
Sumbu panjang menandakan penolakan harga. Ia menunjukkan bahawa harga telah mencapai tahap itu. Walau bagaimanapun, ia juga menunjukkan bahawa pasaran pantas menolak harga kembali ke tempat pasaran dibuka, mewujudkan sumbu panjang dan badan kecil.
Walaupun kesederhanaannya, corak bar pin sangat berkesan. Malah, apabila digunakan dalam tahap sokongan atau rintangan yang betul atau bertembung dengan penunjuk lain, bar pin boleh menghasilkan isyarat dengan kebarangkalian menang yang sangat tinggi.
Penunjuk Pin Bar memudahkan kaedah mengenal pasti corak bar pin. Ia hanya memplot anak panah yang menghalakan bar pin dan arah corak bar pin apabila ia mengesannya. Pedagang boleh menggunakan ini sebagai isyarat kemasukan untuk membantu mereka memasuki perdagangan secara objektif.
Reben MA Diisi 89-21
Reben MA diisi 89-21 ialah arah aliran mengikut penunjuk teknikal berdasarkan purata bergerak. Ia memplot sepasang purata bergerak yang diubah suai. Garis purata bergerak lebih pantas ditetapkan pada 21 tempoh, manakala garis purata bergerak lebih perlahan ditetapkan pada 89 tempoh. Oleh itu nama 89-21.
Garisan purata bergerak juga boleh diubah suai berdasarkan jenis, tempoh dan sumber pengiraannya, sama ada ia terbuka, tutup, tinggi, rendah atau median.
Arah aliran adalah berdasarkan cara dua baris disusun. Penunjuk juga menaungi kawasan antara dua garisan untuk menunjukkan arah aliran.
Arah aliran adalah menaik jika garisan yang bergerak lebih pantas berada di atas garisan yang lebih perlahan dan kawasan antara garisan tersebut dilorekkan dengan warna merah. Sebaliknya, arah aliran menurun jika garisan yang lebih pantas berada di bawah garisan yang lebih perlahan dan kawasan di antara garisan adalah kapur berlorek.
Tindakan harga juga cenderung untuk kekal di atas garisan dalam aliran menaik, dan di bawah garisan dalam aliran menurun.
Garisan juga cenderung cerun ke arah cerun dengan pembalikan sekali-sekala pada garisan yang lebih pantas semasa anjakan.
Strategi Trading
Strategi Dagangan Forex Lantunan Pin Bar Mudah ialah strategi mengikuti aliran mudah yang menggunakan penunjuk MA Ribbon Filled 89-21 dan penunjuk Pin Bar untuk membantu kami mengenal pasti persediaan perdagangan.
Penunjuk MAR Ribbon Filled 89-21 digunakan untuk mengenal pasti arah aliran. Aliran adalah berdasarkan cara dua garisan bersilang dan warna kawasan antara dua garisan purata bergerak.
Kawasan di antara dua garisan juga bertindak sebagai kawasan sokongan atau rintangan yang dinamik.
Harga harus menjejak semula ke arah kawasan ini.
Isyarat dagangan dijana sebaik sahaja penunjuk Pin Bar memplot anak panah yang menunjukkan arah aliran. Ini menunjukkan bahawa harga akan melantun kawasan tersebut.
Petunjuk:
- Reben MA diisi.89.21
- Pinbar
Rangka Masa Pilihan: Carta 4 jam dan harian
Pasangan Mata Wang: Jurusan FX, bawah umur dan salib
Sesi Dagangan: sesi Tokyo, London dan New York
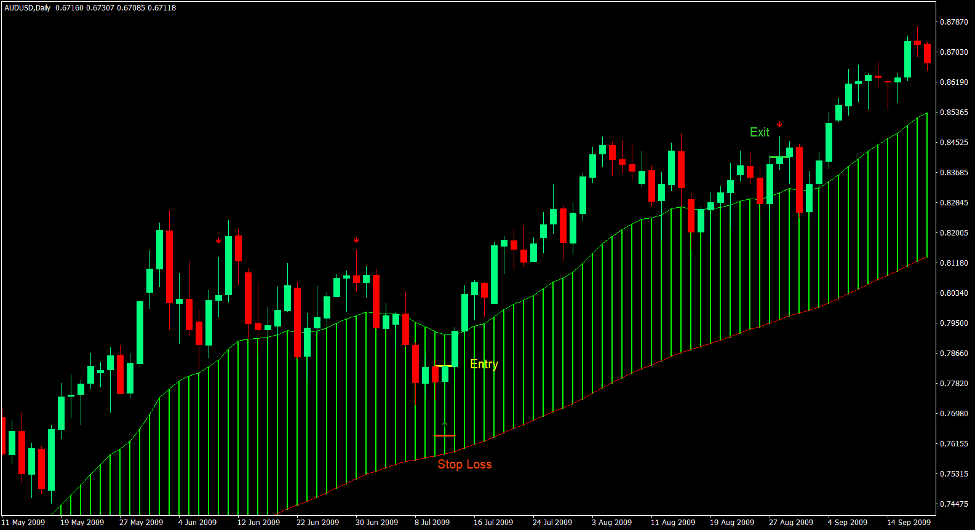
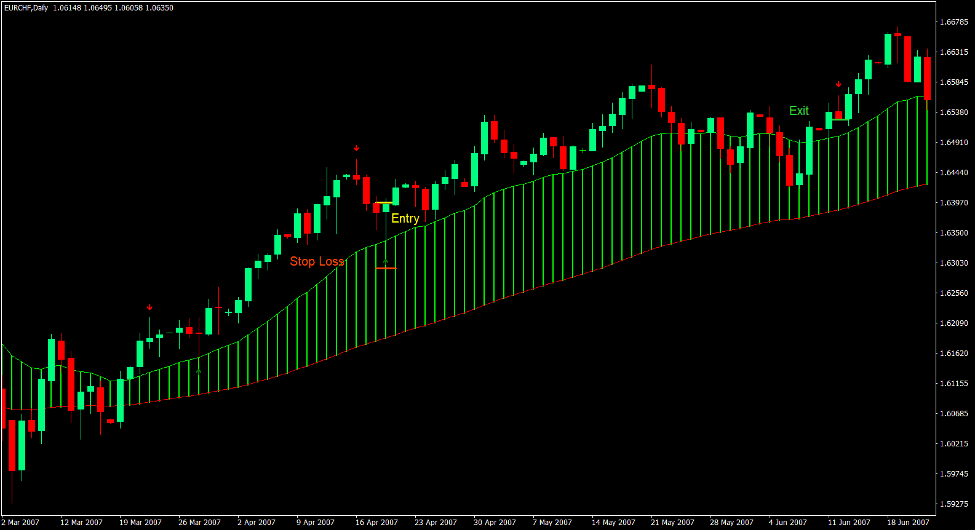
Beli Persediaan Perdagangan
Kemasukan
- Garisan kapur penunjuk MA Ribbon Filled 89-21 harus berada di atas garis merah.
- Kawasan di antara dua garisan hendaklah kapur.
- Tindakan harga harus menaik berdasarkan perubahan harga.
- Harga harus menjejak semula ke arah kawasan antara dua baris.
- Masukkan pesanan beli sebaik sahaja penunjuk Pin Bar memplot anak panah menghala ke atas.
Stop Loss
- Tetapkan stop loss di bawah anak panah.
Keluar
- Tutup dagangan sebaik sahaja penunjuk Pin Bar memplot anak panah menunjuk ke bawah.
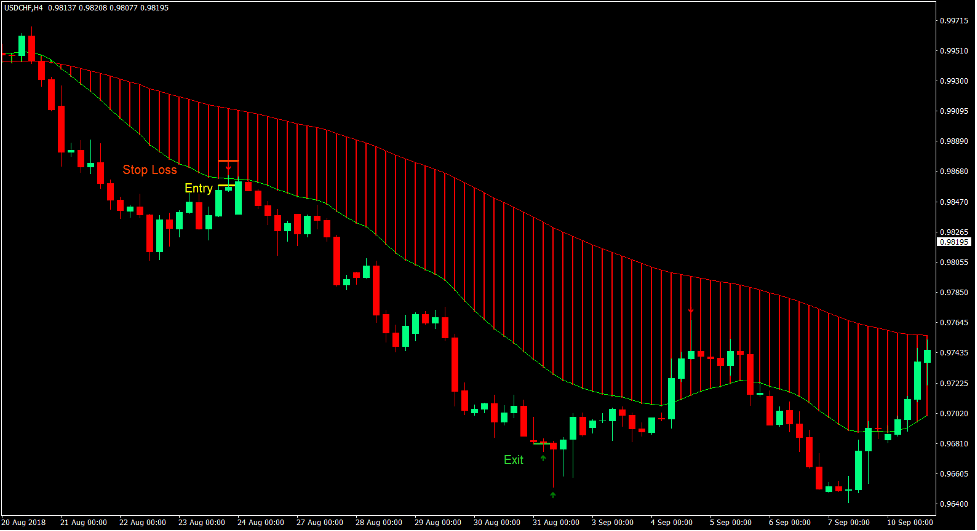
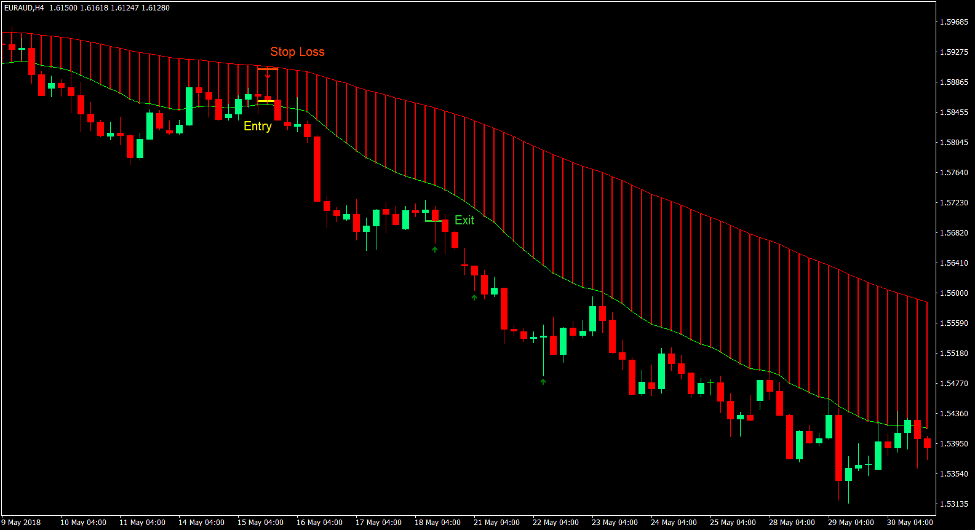
Jual Persediaan Perdagangan
Kemasukan
- Garisan kapur penunjuk MA Ribbon Filled 89-21 harus berada di bawah garis merah.
- Kawasan di antara dua garisan hendaklah berwarna merah.
- Tindakan harga harus menurun berdasarkan perubahan harga.
- Harga harus menjejak semula ke arah kawasan antara dua baris.
- Masukkan pesanan jual sebaik sahaja penunjuk Pin Bar memplot anak panah menunjuk ke bawah.
Stop Loss
- Tetapkan stop loss di atas anak panah.
Keluar
- Tutup dagangan sebaik sahaja penunjuk Pin Bar memplot anak panah menghala ke atas.
Kesimpulan
Strategi ini ialah contoh yang baik tentang cara corak candlestick boleh digunakan untuk mengenal pasti penyambungan semula arah aliran dalam keadaan pasaran arah aliran.
Corak bar pin adalah petanda baik pembalikan. Ia juga berfungsi dengan baik dalam menunjukkan pembalikan pembalikan pendek.
Walaupun strategi ini mempunyai kebarangkalian yang sangat tinggi untuk menunjukkan arah tindakan harga dalam masa terdekat, ia masih boleh menghasilkan beberapa dagangan yang rugi.
Kehilangan dagangan adalah perkara biasa apabila pedagang meletakkan henti kerugian yang ketat menggunakan strategi ini. Walau bagaimanapun, jika digunakan dengan jarak stop loss yang betul, strategi ini cenderung untuk menghasilkan persediaan perdagangan berkualiti tinggi yang boleh menghasilkan keuntungan secara konsisten.
Broker MT4 yang disyorkan
Broker XM
- Percuma $ 50 Untuk Mula Berdagang Dengan Segera! (Keuntungan yang boleh dikeluarkan)
- Bonus Deposit sehingga $5,000
- Program Kesetiaan Tanpa Had
- Broker Forex Pemenang Anugerah
- Bonus Eksklusif Tambahan Sepanjang tahun

>> Daftar untuk Akaun Broker XM di sini <
Broker FBS
- Berdagang 100 Bonus: Percuma $100 untuk memulakan perjalanan dagangan anda!
- 100% Bonus Deposit: Gandakan deposit anda sehingga $10,000 dan berdagang dengan modal yang dipertingkatkan.
- Leverage hingga 1: 3000: Memaksimumkan potensi keuntungan dengan salah satu pilihan leveraj tertinggi yang ada.
- Anugerah 'Broker Perkhidmatan Pelanggan Terbaik Asia': Kecemerlangan yang diiktiraf dalam sokongan dan perkhidmatan pelanggan.
- Promosi bermusim: Nikmati pelbagai bonus eksklusif dan tawaran promosi sepanjang tahun.

>> Daftar untuk Akaun Broker FBS di sini <
Klik di sini di bawah untuk memuat turun: