


Strategi kemasukan pembalikan arah aliran boleh menjadi alat yang sangat baik yang boleh membantu pedagang membuka dagangan dengan lebih tepat pada jangka masa yang lebih rendah. Malah, kebanyakan peniaga pelbagai jangka masa menggunakan strategi pembalikan arah aliran pada jangka masa yang digerudi untuk mencari entri dagangan optimum mereka.
Strategi yang dibincangkan di bawah ialah strategi pembalikan arah aliran yang menggunakan Penunjuk Stochastic Higher High dan Lower Lower dan pindah silang purata bergerak, yang boleh digunakan sebagai persediaan kemasukan perdagangan.
Penunjuk Stokastik Tinggi Tinggi dan Rendah Rendah
Penunjuk Stochastic Higher High dan Lower Lower Stochastic (HHLLS) ialah trend mengikut penunjuk teknikal yang berdasarkan teori Vitali Apirine dalam artikelnya "Higher Higher & Lower Low". Penunjuk HHLLS telah dibangunkan untuk membantu peniaga mengenal pasti arah aliran yang berpotensi muncul, memerhati tempoh pembetulan pasaran dan menjangkakan potensi pembalikan pasaran.
Penunjuk HHLLS menggunakan algoritma yang mengira Nilai Tinggi Lebih Tinggi dan Nilai Rendah Lebih Rendah yang diperoleh daripada data sejarah terkini tentang harga tertinggi dan rendah daripada setiap lilin. Ia kemudian memplotkan Nilai Tinggi Lebih Tinggi dan Nilai Rendah Rendah sebagai garisan yang berayun dalam julat yang dinormalisasi dalam lingkungan 100. Garisan ini ialah garisan Tinggi Tinggi dan Rendah Rendah. Garis Tinggi Tinggi diplot sebagai garis hijau, manakala garis Rendah Bawah diplot sebagai garis merah jingga. Penunjuk juga menaungi kawasan antara dua garisan berdasarkan yang mana antara dua garisan berada di atas.
Penunjuk HHLLS boleh digunakan untuk mengenal pasti arah aliran berdasarkan hubungan garisan Tinggi Tinggi dan Rendah Rendah. Kecenderungan arah aliran atau momentum adalah menaik apabila garis Tinggi Tinggi berada di atas garisan Rendah Bawah. Sebaliknya, kecenderungan arah aliran atau momentum adalah menurun jika garis Rendah Bawah berada di atas garisan Tinggi Lebih Tinggi. Persilangan ini juga akan mendorong perubahan warna teduh antara dua garisan. Crossover tersebut boleh digunakan sebagai isyarat pembalikan arah aliran atau momentum.
Sebagai pengayun, Penunjuk HHLLS juga boleh digunakan untuk mengenal pasti pasaran terlebih jual dan terlebih beli. Pedagang boleh memerhati sama ada garis Tinggi Tinggi atau Rendah Rendah menghampiri hujung atas julat pengayun dan menilai sama ada pasaran terlebih beli atau terlebih jual berdasarkan ini.
10 EMA dan 20 EMA Crossover
Garis purata bergerak boleh menjadi penunjuk berguna untuk mengenal pasti arah aliran dan potensi pembalikan arah aliran. Ia bukan alat yang sempurna, tetapi ia boleh membantu pedagang yang belum yakin dalam mengesan arah aliran menggunakan tindakan harga sahaja.
Salah satu cara peniaga mengenal pasti arah aliran menggunakan garis purata bergerak adalah dengan memasangkan dua garis purata bergerak di mana satu lebih responsif terhadap pergerakan harga berbanding pasangannya. Pedagang boleh mengenal pasti arah aliran kenaikkan apabila garis purata bergerak lebih pantas berada di atas garis purata pergerakan lebih perlahan. Sebaliknya, arah aliran akan menurun jika garis purata bergerak lebih pantas berada di bawah garis purata bergerak lebih perlahan. Memandangkan premis ini, ia juga mengikuti bahawa persilangan antara garisan purata bergerak yang lebih pantas dan lebih perlahan juga boleh digunakan sebagai isyarat pembalikan arah aliran yang berpotensi.
Dalam strategi ini, kami akan menggunakan Purata Pergerakan Eksponen (EMA) 10 bar dan garisan EMA 20 bar untuk mentafsir arah aliran dan potensi pembalikan arah aliran. Kaedah Purata Pergerakan Eksponen memplot garis purata bergerak yang lebih responsif, yang mengurangkan ketinggalan dengan ketara, sementara pada masa yang sama mengekalkan kelancaran ayunannya, mengurangkan kerentanannya terhadap lonjakan harga. Tempoh 10 bar dan 20 bar juga menyediakan isyarat yang lebih selaras dengan arah aliran jangka pendek. Ini membolehkan peniaga bertindak balas dengan lebih cepat kepada perubahan arah aliran.
Konsep Strategi Dagangan
Higher High dan Lower Lower Stochastic Reversal Strategi Trading Forex untuk MT5 ialah strategi perdagangan pembalikan arah aliran yang menggunakan pertembungan antara persilangan purata bergerak dan penunjuk Stochastic Higher High dan Lower Lower sebagai asas untuk mengenal pasti dan mengesahkan potensi pembalikan arah aliran.
Pembalikan arah aliran yang berpotensi boleh diperhatikan pada penunjuk HHLLS berdasarkan persilangan garisan Tinggi Tinggi dan garisan Rendah Bawah. Arah pembalikan arah aliran akan berdasarkan sama ada garisan Higher Higher melintasi di atas garis Lower Low atau sebaliknya.
Isyarat pembalikan sedemikian tidak seharusnya menjadi isyarat kendiri. Ia juga harus disahkan berdasarkan tindakan harga memecahkan sama ada ayunan tinggi atau ayunan rendah bergantung pada arah aliran. Ini akan menunjukkan bahawa kemungkinan pembalikan arah aliran adalah mungkin.
Pembalikan arah aliran yang berpotensi kemudiannya disahkan hanya apabila petunjuk di atas bertembung dengan persimpangan 10 garisan EMA dan 20 EMA dalam persetujuan dengan arah isyarat yang ditunjukkan di atas.
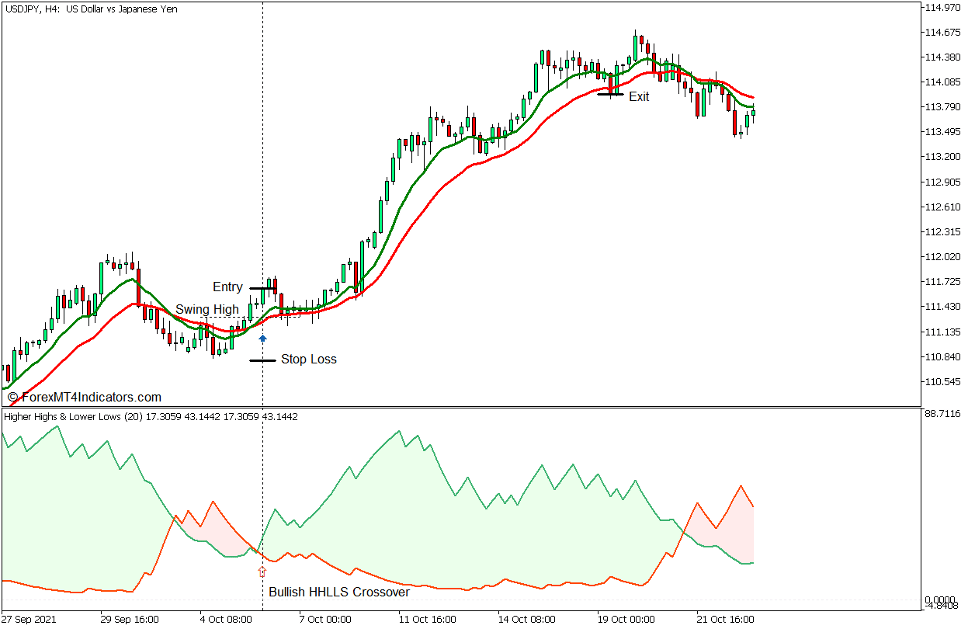
Beli Persediaan Perdagangan
Kemasukan
- Garisan Higher High harus melintasi di atas garis Lower Low.
- Tindakan harga sepatutnya pecah dan ditutup di atas ayunan tinggi terkini.
- Garisan 10 EMA (hijau) harus melintasi di atas garisan 20 EMA (merah).
- Buka pesanan beli pada pertemuan petunjuk ini.
Stop Loss
- Tetapkan stop loss di bawah ayunan rendah terkini.
Keluar
- Tutup dagangan hanya apabila harga akan ditutup di bawah garisan 20 EMA.
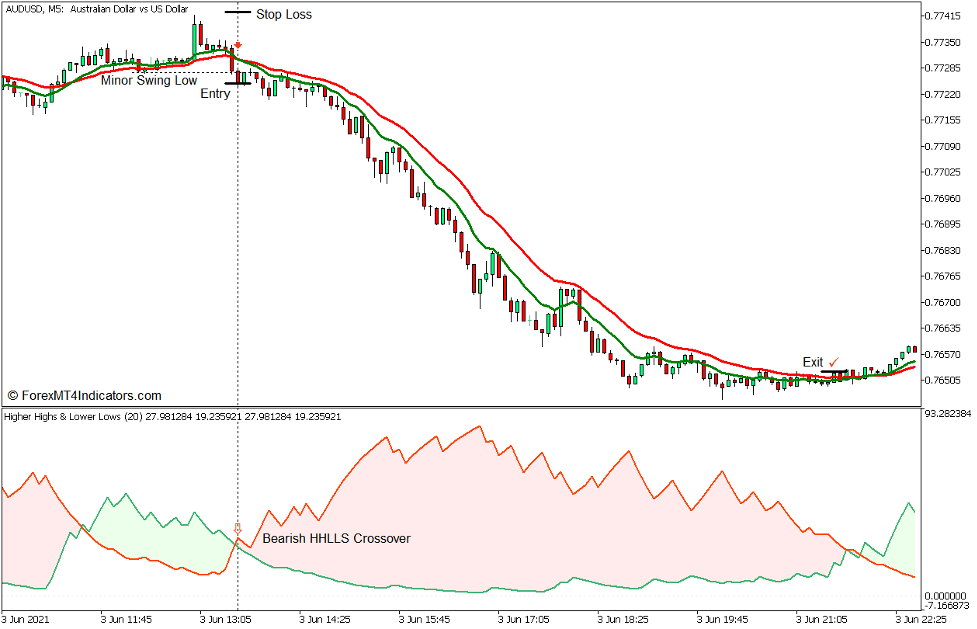
Jual Persediaan Perdagangan
Kemasukan
- Garis Terendah Bawah harus melintasi garisan Tertinggi Tertinggi.
- Tindakan harga sepatutnya turun dan ditutup di bawah ayunan rendah terkini.
- Garisan 10 EMA (hijau) harus melintasi di bawah garisan 20 EMA (merah).
- Buka pesanan jual pada pertemuan petunjuk ini.
Stop Loss
- Tetapkan stop loss di atas ayunan tinggi terkini.
Keluar
- Tutup dagangan hanya apabila harga akan ditutup di atas garisan 20 EMA.
Kesimpulan
Mengenal pasti potensi pembalikan arah aliran berdasarkan pembalikan tindakan harga, yang ditunjukkan oleh penembusan ayunan tinggi atau ayunan rendah sudah menjadi isyarat pembalikan yang berkesan. Walau bagaimanapun, teknik ini mungkin menakutkan pedagang baharu yang belum terbiasa dengan subjektiviti mengenal pasti pembalikan berdasarkan tindakan harga. Menambahkan pertemuan dua isyarat pembalikan berasaskan penunjuk menambah elemen objektiviti dalam isyarat dagangan, membolehkan pedagang memasuki dagangan dengan cara yang sistematik.
Strategi perdagangan yang dibincangkan di atas boleh menjadi strategi kemasukan perdagangan yang sangat berkesan. Walau bagaimanapun, ia lebih baik digunakan dalam pertemuan dengan persediaan perdagangan lain berdasarkan strategi dagangan jangka masa yang lebih tinggi.
Broker MT5 yang disyorkan
Broker XM
- Percuma $ 50 Untuk Mula Berdagang Dengan Segera! (Keuntungan yang boleh dikeluarkan)
- Bonus Deposit sehingga $5,000
- Program Kesetiaan Tanpa Had
- Broker Forex Pemenang Anugerah
- Bonus Eksklusif Tambahan Sepanjang tahun

>> Daftar untuk Akaun Broker XM di sini <
Broker FBS
- Berdagang 100 Bonus: Percuma $100 untuk memulakan perjalanan dagangan anda!
- 100% Bonus Deposit: Gandakan deposit anda sehingga $10,000 dan berdagang dengan modal yang dipertingkatkan.
- Leverage hingga 1: 3000: Memaksimumkan potensi keuntungan dengan salah satu pilihan leveraj tertinggi yang ada.
- Anugerah 'Broker Perkhidmatan Pelanggan Terbaik Asia': Kecemerlangan yang diiktiraf dalam sokongan dan perkhidmatan pelanggan.
- Promosi bermusim: Nikmati pelbagai bonus eksklusif dan tawaran promosi sepanjang tahun.

>> Daftar untuk Akaun Broker FBS di sini <
Klik di sini di bawah untuk memuat turun: