


TDI Crossover Forex Strategy
The Trader’s Dynamic Index, better known as TDI, is an indicator that seems to have it all. It is an oscillating indicator, has a moving average component in it, an RSI, and the Bollinger Bands. It seems so complete a trader might never need another indicator.
Many use it as it is, and that is totally fine. Many do make money using the TDI as it is meant to be used. However, because of its many components, it has the tendency to become so restrictive that the trades one can take using it become so few.
With this strategy, we will simplify the use of the TDI indicator. We will be removing the Bollinger Bands to allow more trades to be taken.
To trade this strategy, we will be looking for crossovers of the RSI over the moving average line. This will be represented by the green and red lines.
The Buy Setup: Entry, Stop Loss & Exit
Buy Entry: To enter the trade, the RSI line represented by the green line should be crossing above the moving average line represented by the red line.
Stop Loss: The stop loss should be a few pips below the most recent minor swing low.
Exit: The trade should be closed as soon as the RSI hooks or bends downward.
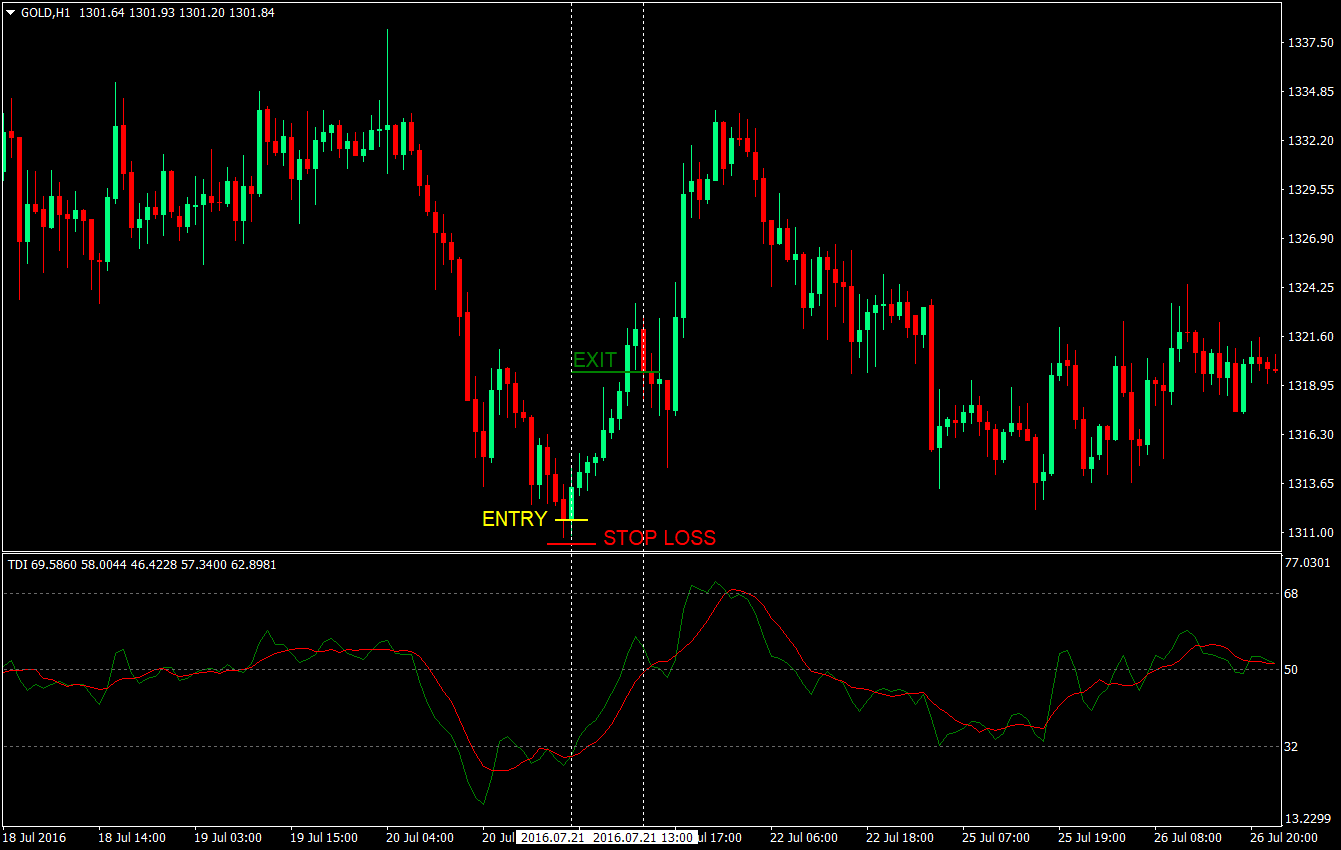
On this trade setup, the trade should have been entered on the open of the candle where the green line crossed above the red line. The stop loss should be just a few pips below the latest swing low, at just 13 pips. And the trade should have been closed when the RSI sharply turned back down. The trade should have profited for 80 pips, giving it a 1:6.15 risk reward ratio.
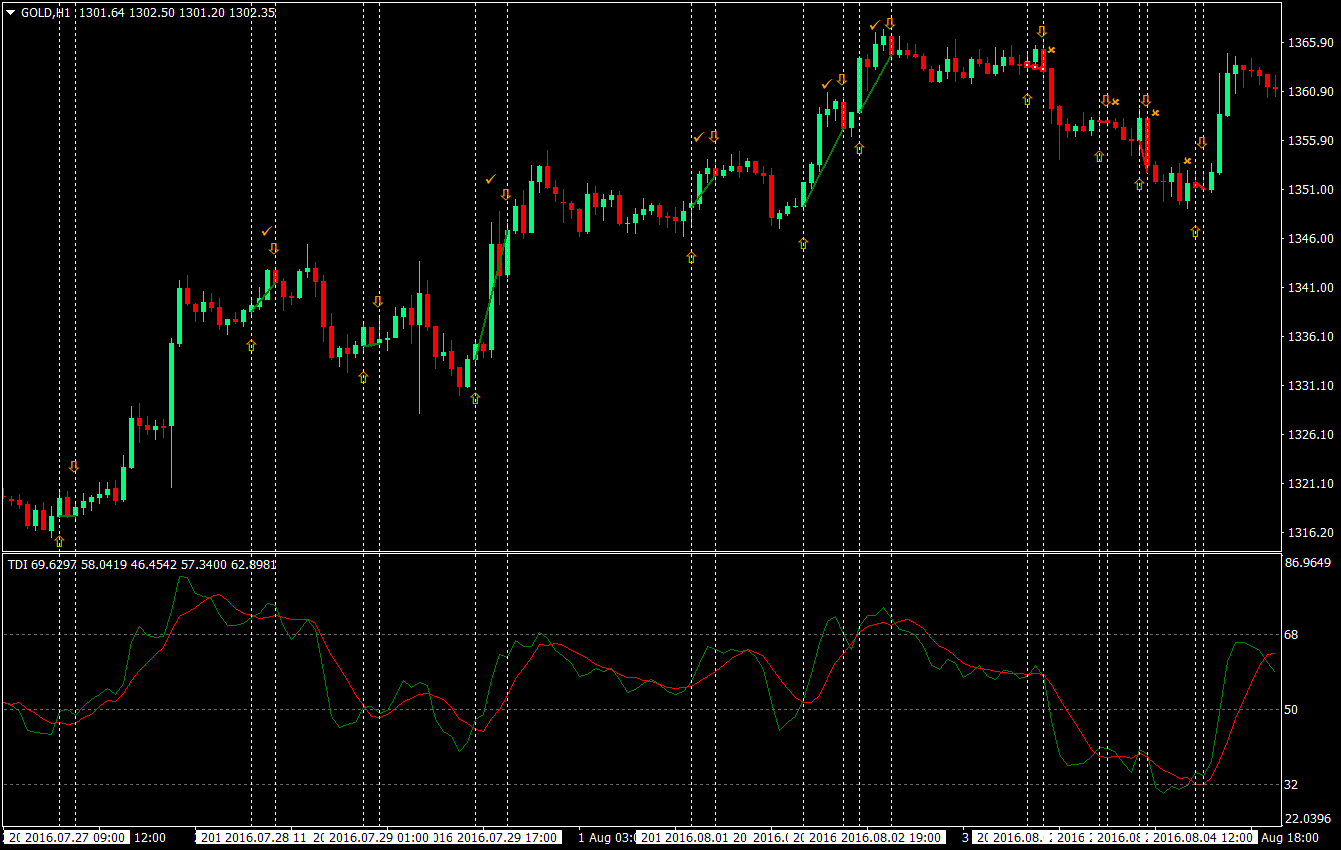
On the chart below, all possible trades using this strategy was tested to check if the strategy does have an edge. Out of the 11 trades taken, 5 were winners, 4 were losers, and 2 were breakeven with a possible few pips profit. Even though the win rate ratio is not that high, however, because the winning trades were gaining big, and the loosing trades were losing small, the trader should still have ended the period with a profit. This means that this strategy has an edge.
The Sell Setup: Entry, Stop Loss & Exit
Sell Entry: To enter the trade, the RSI line represented by the green line should be crossing below the moving average line represented by the red line.
Stop Loss: The stop loss should be a few pips above the most recent minor swing low.
Exit: The trade should be closed as soon as the RSI hooks or bends upward.
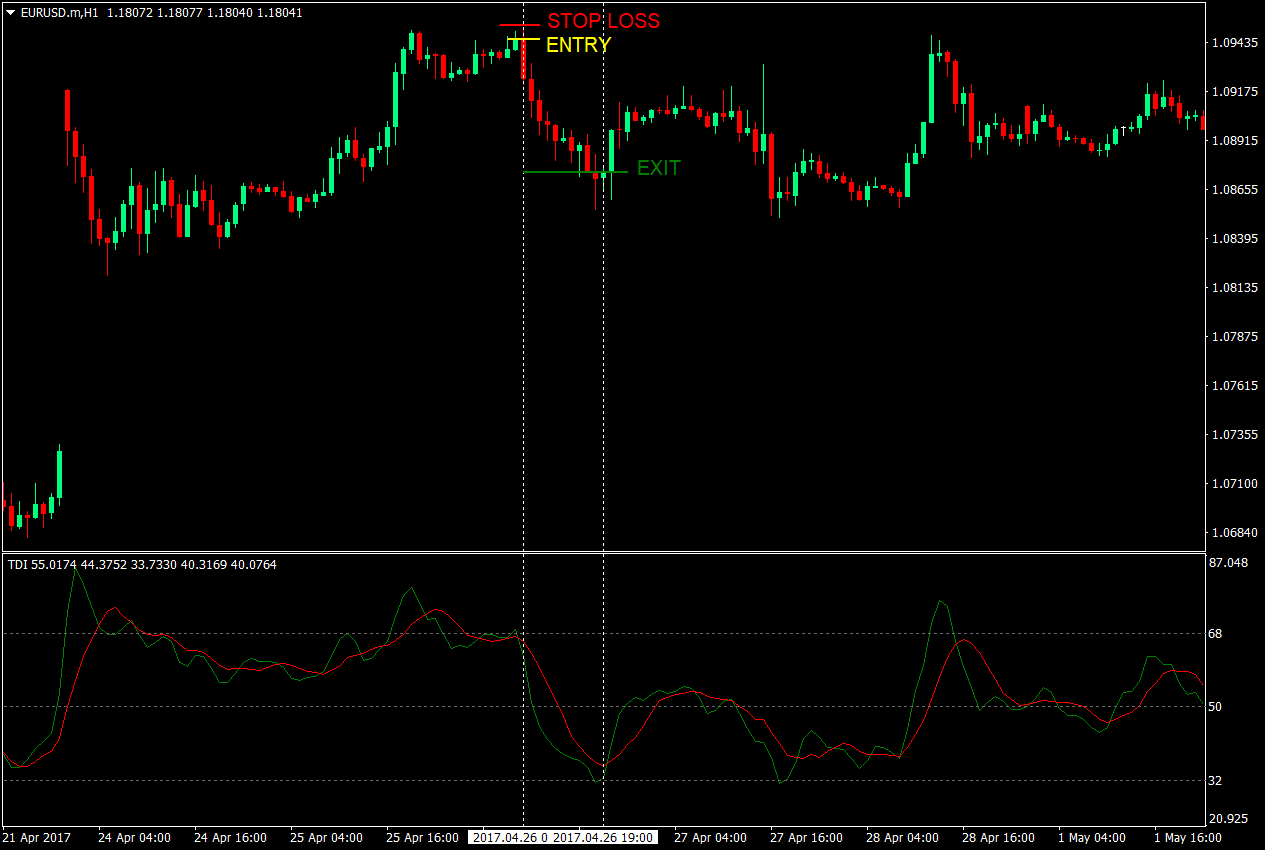
This trade setup should have gained 71 pips while risking only 8 pips on the stop loss. That would have been a risk reward ratio of 1:8.875.
To test the strategy, all the possible trades were tested on this chart. Out of the 12 trades taken, 8 were winners, 3 were losers, and one was at breakeven. Again, the average pips gained on the winners were higher than the average pips lost on the losers. This gives the strategy a trading edge.
Conclusion
This strategy is not perfect. It still gets some losing trades. This is because the strict rules of the TDI indicator strategy is loosened up to get more trades. However, even with the easier rules, the trade still had a winning percentage. The cherry on top is that the average pips gained on winners is higher than the average pips lost on the losers. This gives the strategy a slight trading edge.
If you would rather have a high winning percentage rather than more trades, what you could do though is learn the original TDI strategy.
Recommended MT4 Broker
- Free $50 To Start Trading Instantly! (Withdrawable Profit)
- Deposit Bonus up to $5,000
- Unlimited Loyalty Program
- Award Winning Forex Broker
- Additional Exclusive Bonuses Throughout The Year

>> Claim Your $50 Bonus Here <<
Click here below to download: