


Trading is not about luck or chance. It is not gambling, hoping to get a win out of every trade. On the flip side, nothing is sure in trading. In fact, anything can happen in trading. So, where does this lead us? It is not about chance and yet you can never be sure in trading?
Well, trading is about probabilities. It is about stacking up all the indications of a trend direction. It is about looking for common directions coming from different thesis in order to have a higher probability of a win. These directions could come from indicators, price action, price and candlestick patterns or whatever high probability technical analysis that could give traders clues as to where price is going. This is what traders call confluence.
For example, one indicator could have a slight edge with just a 55% probability of pointing out the right direction. Then, another indicator would give another 55% probability. Individually, these indicators might not be much of an edge. It might be like flipping a coin. However, if a trader decides to take these indicators signals only when they are in confluence and provides trade signals at approximately the same time, the probabilities could improve. What used to be a 55% probability could now be a 60% probability or more. Any trader would be glad to take that edge. That is what confluence does.
SAR Smooth Trend Forex Trading Strategy is a strategy that employs to high probability trend following indicators. This strategy allows traders to take trades that have a relatively high probability of producing profits by making sure that traders are trading on confluences of a trend reversal and momentum.
Parabolic Stop and Reverse
Parabolic SAR, also known as Parabolic Stop and Reverse, is a trend following indicator popularly used by many traders.
This indicator is mainly used by traders to determine trend and momentum of a trading asset. It does this by plotting dots on the price chart. Dots that are placed below price action is indicative of a bullish trend, while price that is placed above price action indicates a bearish trend.
The second function of the Parabolic SAR is to help traders identify ideal stop loss placements. The same dots are points which nullify an existing trend. In theory, if price breaches the dots, then the trend is considered to have reversed or ended. This makes it an ideal placement for a stop loss.
The Parabolic SAR assumes that a trader is always invested in the market, thus the name “Stop and Reverse”. Traders simply enter the market to the opposite direction as the market reverses. This sounds good in theory. However, it does not always work. This would work well in trending markets, but it would cause significant losses when used in a choppy market. The developer of the indicator advices to use this indicator in confluence with other indicators that help identify trend direction. It would also benefit from candlestick patterns that could indicate a trend reversal.
Heiken Ashi Smoothed
Heiken Ashi Smoothed is a trend following technical indicator which is a variation of the Heiken Ashi Candlesticks.
Heiken Ashi basically means average bars. In a way, the Heiken Ashi Candlesticks were literally an average bar. These are candlesticks that show the high and low of a candle and changes color only when the average price of the historical bars has indicated a change in direction.
The Heiken Ashi Smoothed indicator on the other hand is not based on the usual candlesticks. Instead, it is based on the Exponential Moving Average (EMA). This creates bars that move smoothly just as an EMA line would.
The Heiken Ashi Smoothed indicator is a very reliable trend following indicator. It tends to reverse only when the market has a very high probability of reversing.
Trading Strategy
This strategy provides trend reversal signals using the confluence of the Heiken Ashi Smoothed and Parabolic SAR indicators.
On the Parabolic SAR, the signal would simply be the shifting of the dots signaling the change of trend direction.
The Heiken Ashi Smoothed indicator’s signals would be based on the changing of the color of the bars.
Not all signals would result in a reversal. What we are looking for are signals that are closely aligned as this tends to occur only when there is a strong momentum behind the reversal signal. We would also look for momentum candles adjacent to the reversal signals or the reversal signals are directly aligned with a momentum candle.
Indicators:
- Parabolic SAR (default setting)
- Heiken_Ashi_Smoothed (default setting)
Currency Pairs: major and minor pairs
Preferred Time Frames: 30-minute, 1-hour, 4-hour and daily charts
Trading Sessions: Tokyo, London and New York sessions
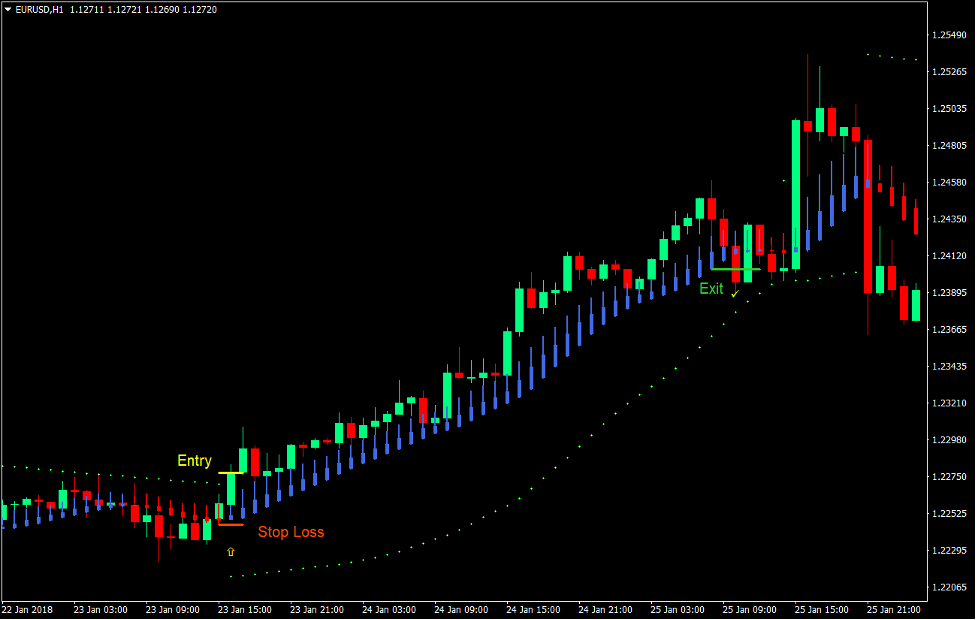
Buy Trade Setup
Entry
- The Parabolic SAR dots should shift below the price candles.
- The Heiken Ashi Smoothed bars should change to blue.
- A bullish momentum candle should be adjacent to the entry candle or the entry candle should be a bullish momentum candle.
- These bullish signals should be closely aligned.
- Enter a buy order on the confirmation of these conditions.
Stop Loss
- Set the stop loss below the Heiken Ashi Smoothed bars.
Exit
- As soon as price moves in the direction of the trade, move the stop loss below the Heiken Ashi Smoothed bars three bars behind the current candle until trade is stopped out.
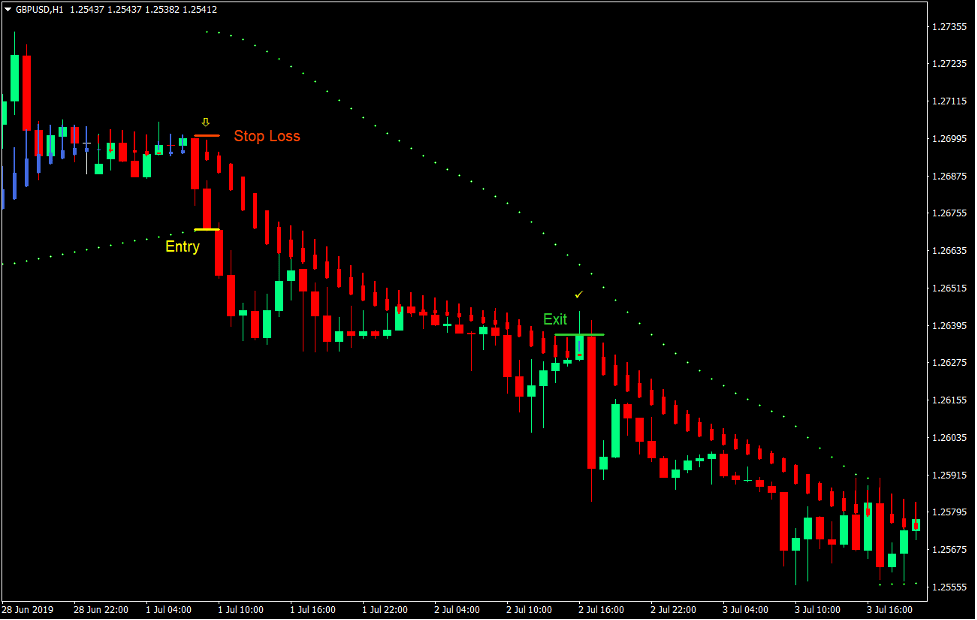
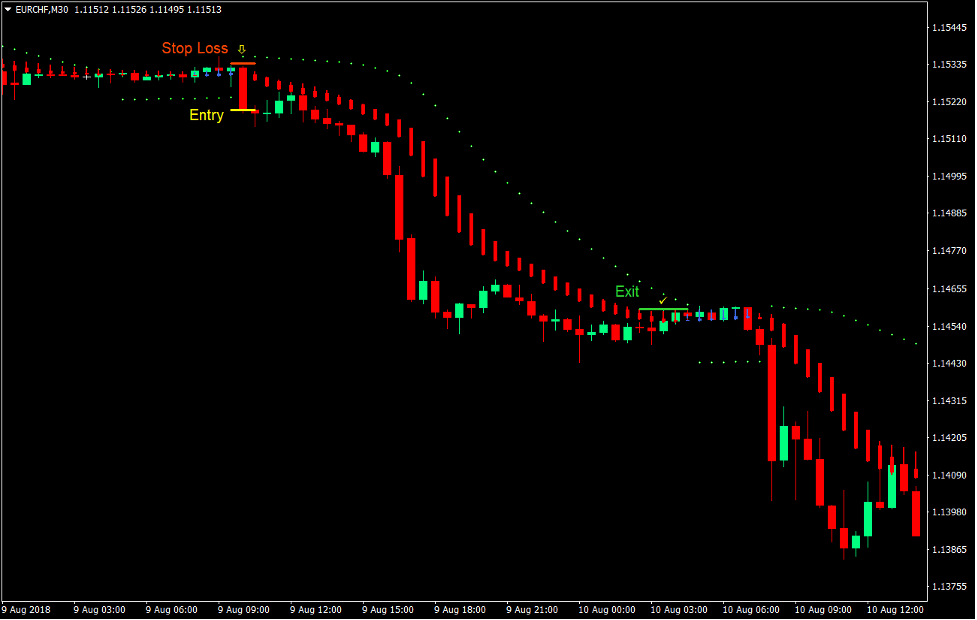
Sell Trade Setup
Entry
- The Parabolic SAR dots should shift above the price candles.
- The Heiken Ashi Smoothed bars should change to red.
- A bearish momentum candle should be adjacent to the entry candle or the entry candle should be a bearish momentum candle.
- These bearish signals should be closely aligned.
- Enter a sell order on the confirmation of these conditions.
Stop Loss
- Set the stop loss above the Heiken Ashi Smoothed bars.
Exit
- As soon as price moves in the direction of the trade, move the stop loss above the Heiken Ashi Smoothed bars three bars behind the current candle until trade is stopped out.
Conclusion
Trading with the trend using these types of indicators work very well during trending market conditions. It also allows traders to capture the whole trend from start to finish. This gives traders high yield trade setups.
However, traders should avoid using this strategy whenever the market is in a choppy condition. It is also best to use this strategy with trend reversals coming from significant points, such as a previous support or resistance level.
Recommended MT4 Brokers
XM Broker
- Free $50 To Start Trading Instantly! (Withdraw-able Profit)
- Deposit Bonus up to $5,000
- Unlimited Loyalty Program
- Award Winning Forex Broker
- Additional Exclusive Bonuses Throughout The Year

>> Sign Up for XM Broker Account here <<
FBS Broker
- Trade 100 Bonus: Free $100 to kickstart your trading journey!
- 100% Deposit Bonus: Double your deposit up to $10,000 and trade with enhanced capital.
- Leverage up to 1:3000: Maximizing potential profits with one of the highest leverage options available.
- ‘Best Customer Service Broker Asia’ Award: Recognized excellence in customer support and service.
- Seasonal Promotions: Enjoy a variety of exclusive bonuses and promotional offers all year round.

>> Sign Up for FBS Broker Account here <<
Click here below to download: