


Crossover strategies are probably one of the most popular types of trading strategies that traders come across with. Almost all traders would come across with this type of trading strategy. This is especially true with new traders. This is because crossover strategies are so easy to implement that anybody can do it. As long as you could identify two lines crossing over, then you are good to go.
However, crossover strategies, even with its simplicity, is not that easy. Traders would often be caught in a situation where they are too late to enter a trade, or they are taking trades in a market that is not reversing. This often causes traders to have successive losses because these market conditions are common in the market. These conditions are called choppy or ranging markets. Choppy markets tend to show no clear direction and would move back and forth without starting a trend. Ranging markets are a bit more defined compared to choppy markets, yet prices are still moving within a fixed range.
Crossover strategies are best suited for a single type of market condition. These are trend reversal market conditions. During these types of conditions, traders who have entered the trade at the start of the trend and exited at the end of the trend come up with huge profits.
Kalman Filter Cross Forex Trading Strategy is a trend reversal strategy that provides trade signals based on crossovers of modified moving averages and a confirmation of a momentum candle. This gives the trade setups the advantage of having that initial boost coming from a momentum candle at the start of the trade, which often causes the market to trend.
HMA v2
HMA basically stands for Hull Moving Average. HMA v2 is a trend following technical indicator which is based on a moving average.
Most moving averages suffer from a common disadvantage. It is either that the moving average line is too lagging or is easily susceptible to false signals coming from choppy market conditions.
A moving average that is too lagging would often cause traders to enter and exit a trade too late, causing them to lose money on an otherwise profitable trade setup.
On the other hand, a moving average that lacks smoothing would easily crossover with price or any other signals even when the trend has not clearly reversed. This would cause traders to take trades that should not have been valid.
HMA v2 manages to smoothen out its moving average line while at the same time making it more responsive to price action movements. This gives us a moving average line that causes less false signals while at the same time allows traders to react to trend reversals more effectively.
The HMA v2 indicator plots a series of dots on the price chart to show the movement of the HMA line. The dots change colors depending on the direction of the trend. A light blue line indicates a bullish trend, while a tomato line indicates a bearish trend.
Kalman Filter
At first glance a trader would think that the Kalman Filter is just another modified moving average, but it is not.
Kalman filtering, also known as Linear Quadratic Estimation (LQE), is an algorithm that uses a series of historical data, which contains statistical noise, and produces an estimation which is often more accurate than those compared with other forms of measurements that are based on a single measurement.
In the case of forex trading, the historical data used are historical price movements. These price movements have noise, which is very prevalent in the market.
When compared with the traditional moving average, the Kalman Filter looks just like a normal moving average line. However, traders could notice that the Kalman Filter moves more smoothly compared to most moving average lines, yet at the same time is more responsive to price movements.
The Kalman Filter indicator plots a line to indicate the direction of the trend. This line changes color depending on the direction of the trend. A turquoise line indicates a bullish trend, while an orange line indicates a bearish trend.
Trading Strategy
This trading strategy is a trend reversal trading strategy trades on crossovers between the HMA v2 dots and the Kalman Filter. However, instead of trading on the actual crossover of the two indicators, it waits for a couple of confirmations.
The crossover between the two would often mean that the HMA v2 dots have either already changed color or is changing color during the crossover. However, the Kalman Filter does not change color right away. It waits for a confirmation built within its algorithm before it changes color. Valid trade setups should have the color of the Kalman Filter line change prior to entering the trade.
On top of this, traders should also consider price action characteristics. A momentum candle should be formed in order to have an increased confidence that price might reverse.
Indicators:
- HMA_v2
- HMA Period: 70
- Kalman_filter
Preferred Time Frames: 1-hour, 4-hour and daily charts
Currency Pairs: FX majors, minors and crosses
Trading Sessions: Tokyo, London and New York sessions
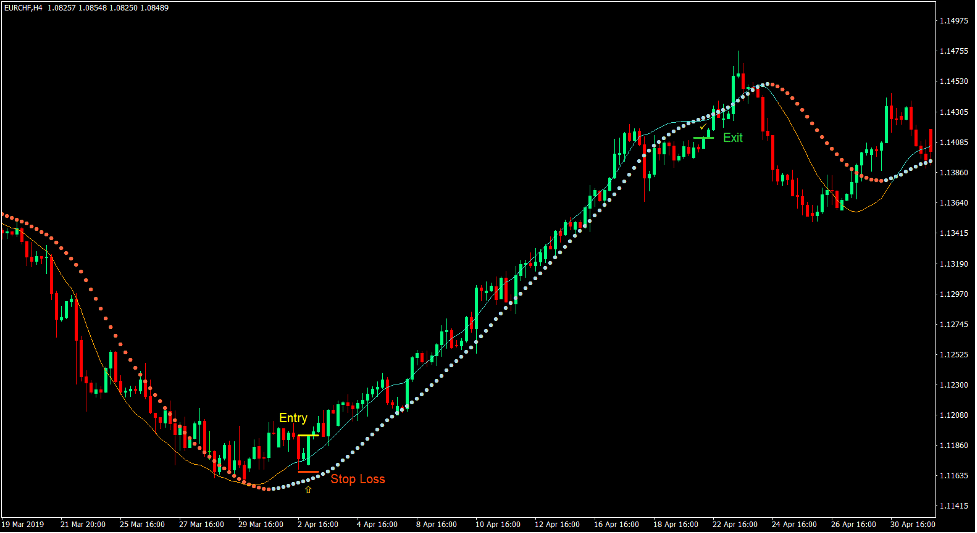
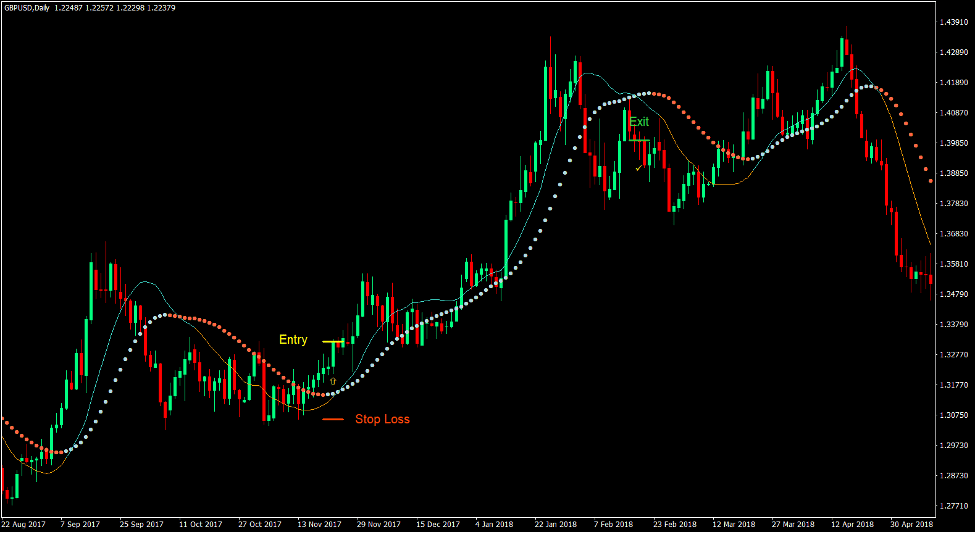
Buy Trade Setup
Entry
- The HMA v2 dots should change to light blue.
- The Kalman Filter line should cross above the HMA v2 dots.
- The Kalman Filter line should change to turquoise.
- A bullish momentum candle should be formed.
- Enter a buy order upon confirmation of these conditions.
Stop Loss
- Set the stop loss on the fractal below the entry candle.
Exit
- Close the trade as soon as the Kalman Filter line crosses below the HMA v2 dots.
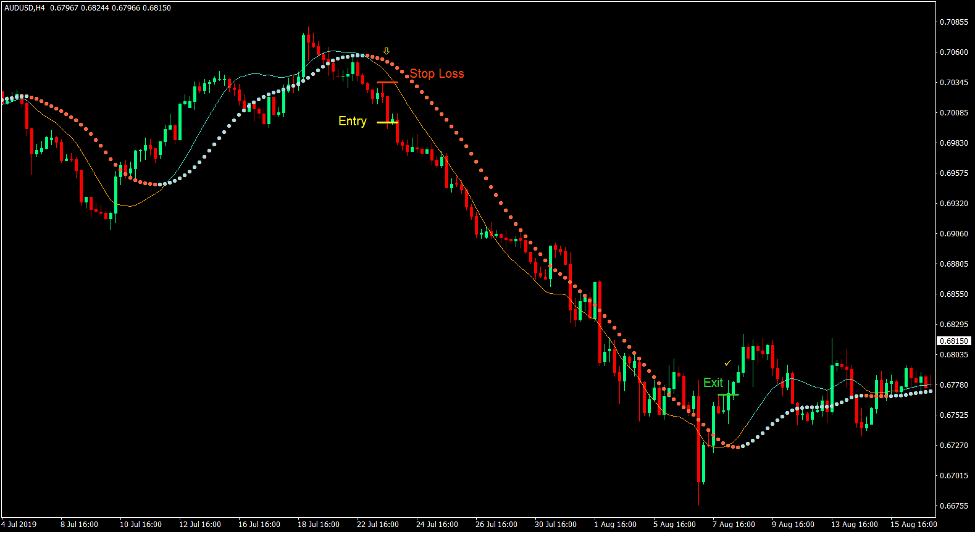
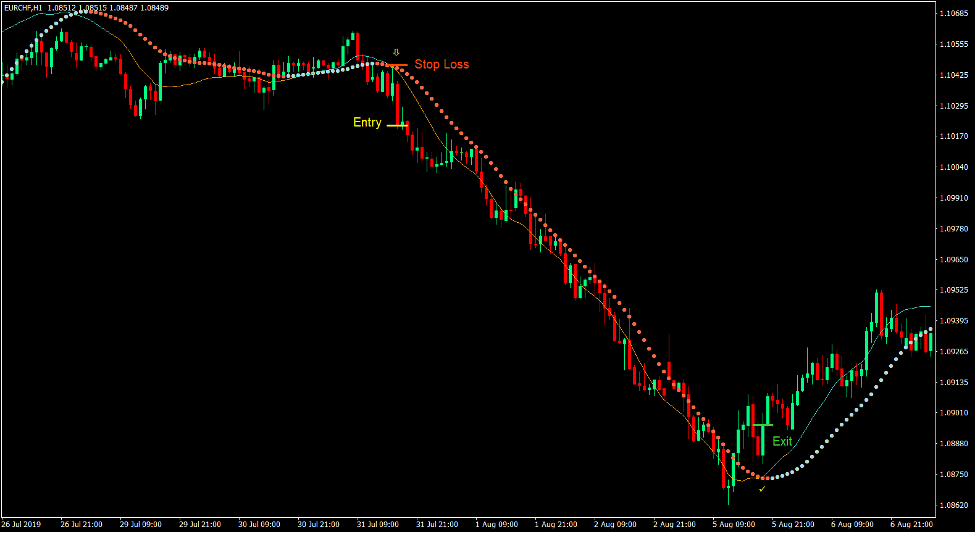
Sell Trade Setup
Entry
- The HMA v2 dots should change to tomato.
- The Kalman Filter line should cross below the HMA v2 dots.
- The Kalman Filter line should change to orange.
- A bearish momentum candle should be formed.
- Enter a sell order upon confirmation of these conditions.
Stop Loss
- Set the stop loss on the fractal above the entry candle.
Exit
- Close the trade as soon as the Kalman Filter line crosses above the HMA v2 dots.
Conclusion
This trend reversal strategy which is based on the crossover of these two indicators is a strategy that could potentially produce huge yields. This is because trade setups could run from the start of the trend up to the time the trend reverses.
However, like most crossover strategies, it does have periods where it is susceptible to false signals. This occurs whenever the market becomes choppy. During these conditions, it is best to avoid trading this strategy. Trade this strategy only when the market tends to produce huge swings that result in trends.
Recommended MT4 Brokers
XM Broker
- Free $50 To Start Trading Instantly! (Withdraw-able Profit)
- Deposit Bonus up to $5,000
- Unlimited Loyalty Program
- Award Winning Forex Broker
- Additional Exclusive Bonuses Throughout The Year

>> Sign Up for XM Broker Account here <<
FBS Broker
- Trade 100 Bonus: Free $100 to kickstart your trading journey!
- 100% Deposit Bonus: Double your deposit up to $10,000 and trade with enhanced capital.
- Leverage up to 1:3000: Maximizing potential profits with one of the highest leverage options available.
- ‘Best Customer Service Broker Asia’ Award: Recognized excellence in customer support and service.
- Seasonal Promotions: Enjoy a variety of exclusive bonuses and promotional offers all year round.

>> Sign Up for FBS Broker Account here <<
Click here below to download: