


Cryptocurrency Trading Strategies [Bollinger Bands]
Here we present you with another bitcoin and other altcoin trading strategy. It is called Bollinger Band and it is an easy-to-use strategy to trade with bitcoins and any other cryptocurrency. While the name is a little fancy, the actual technique is really simple enough. It was devised by veteran trader named John Bollinger who after succeeding in conventional trading, shifted his focus to the most popular cryptocurrency in the world.
The Bollinger bands are indicators that are used to predict extremely profitable trends in the market. The technique was first used in 1980s in the stock market and it banks on the volatility of the market to make a good profit. We all know that cryptocurrencies are much more volatile than actual stocks so that is where Bollinger Band can be adopted for great effect.
Bollinger bands are curves on the coin’s price structure that are accompanied with a moving average (the middle band), an upper band and a lower band. Together the help answer the fundamental question whether the price is high or now relatively. If we can find this critical piece of information, we can make trades for buying or selling our coin.
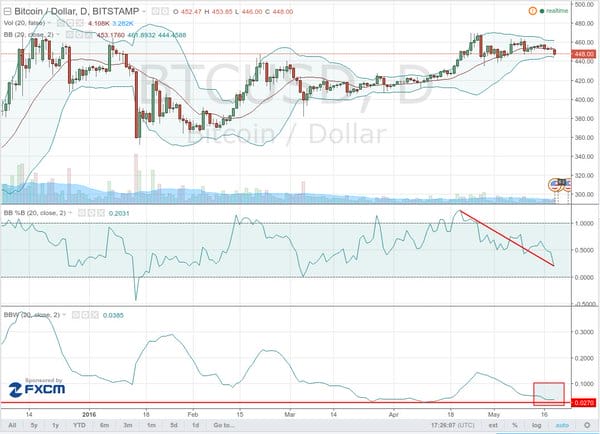
We know from our previous uses of moving average that the width of the band separating the upper resistance and the lower support determines the kind of volatility being experienced in the market. The bigger the bandwidth, the more volatile the coin is and vice versa.
This is a chart that shows 4-hour price shift in BTC-USD with the help of Bollinger Bands.
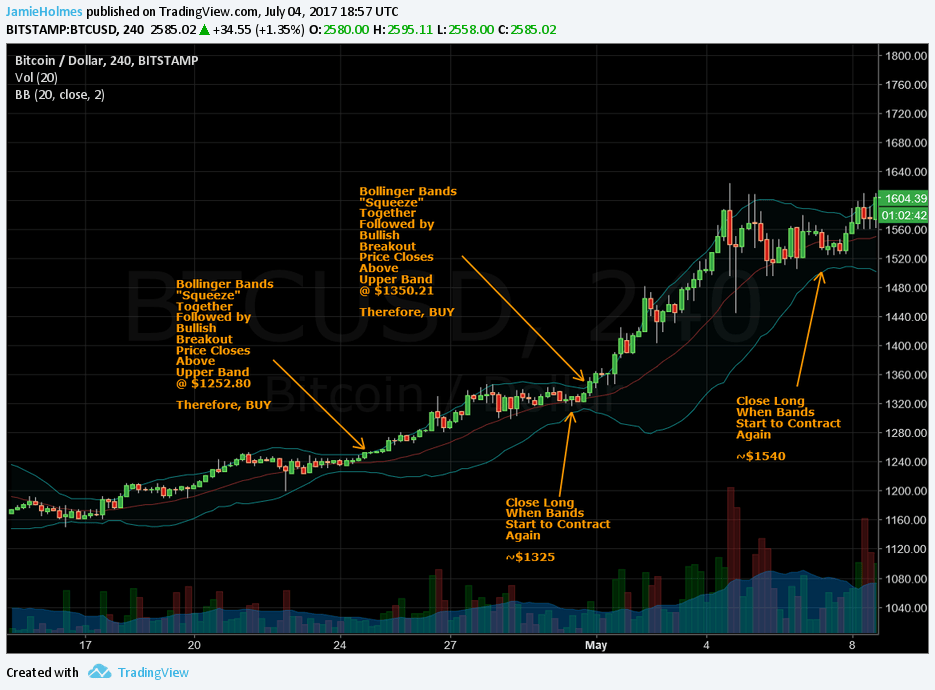
When the bands contract, we wait for a breakout and that always happens either in the positive or the negative direction depending on a variety of factors. Once again green bars show price increase while the red bars show price decrease. The length of these bars show the difference in price during the interval on the graph which is divided into seven portions for each day or around one per 3.4 hours. The bollinger bands can be seen as the resistance and the support lines. It is a really dynamic curve that needs to be understood in order to make the right decisions.
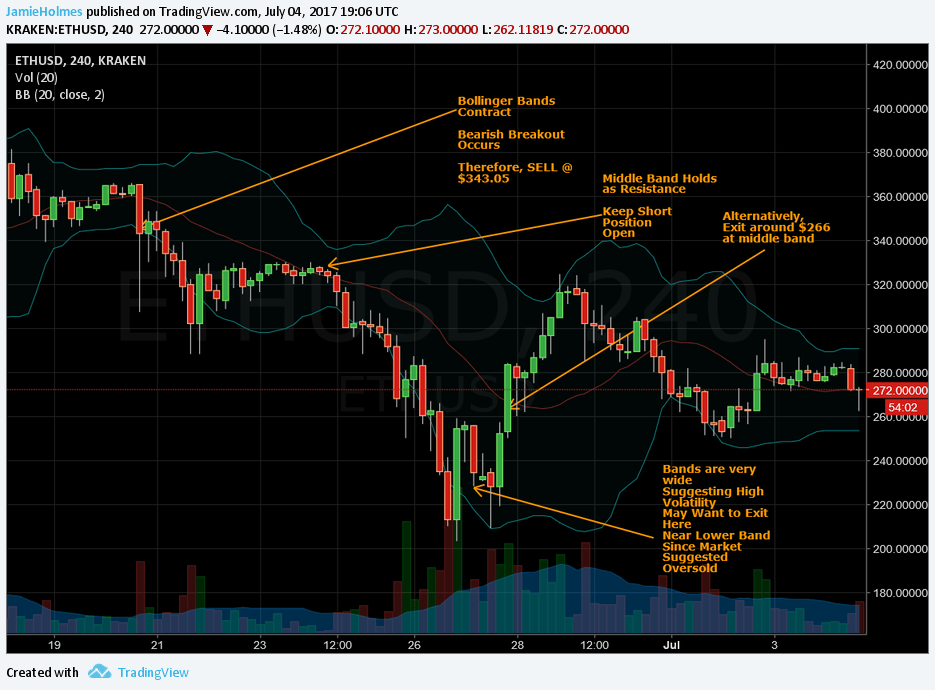
Here you can see the curve in a much more insightful manner.
You are advised to use the Bollinger band with other indicators that you may have already used. While this one is the most dynamic that you have probably used till now, it is not a sure-shot strategy in a market that is too volatile. Even Bollinger himself encourages to use it with other techniques.