


Momentum breakouts is a type of market condition wherein price is moving strongly in one direction, usually within a few candles and at times even started with just one price candle. These candles often breakout of a market contraction phase which are usually characterized by small price, indecisive price candles. The sudden appearance of long full-bodied candle indicate that a market event has occurred that caused traders to either buy or sell immediately.
Momentum breakouts have so much potential. This is because momentum breakouts are often the beginning of a fresh trend. Traders who could catch these fresh trends and ride it out until the end could earn huge yields in a single trade.
However, momentum traders also tend to chase price as the market moves in a certain direction. Momentum traders need a systematic momentum trading strategy which should allow them to objectively identify a proper momentum breakout signal which could result in a fresh trend.
Bollinger Bands
The Bollinger Bands is one of the most versatile technical indicators. It is a trend following technical indicator, which also provides traders information regarding volatility and could also be used to identify mean reversals as well as momentum breakouts.
The Bollinger Bands indicator is composed of three lines.
The middle line is a 20-period Simple Moving Average (SMA) line. As such, traders can use it as a trend indicator. Trend direction can be identified based on the slope of the middle line, as well as the general location of price action in relation to the line. Trend reversal signals could also be identified based on the crossing over of price action and the middle line.
The two outer lines are basically standard deviations from the middle line. These lines are usually set at two standard deviations shifted above and below the middle line.
Since the outer lines are based on a standard deviation, the Bollinger Bands can be used to identify volatility. Expanding bands indicate an expanding market phase, while contracting bands indicate a contracting market phase.
Mean reversal traders also use the Bollinger Bands to identify probable mean reversals from overbought or oversold price conditions. The area outside the outer lines are considered oversold and overbought areas. Price candles showing signs of price rejection outside of the line could indicate that price is either overbought or oversold and could soon reverse.
Momentum traders on the other hand use the outer lines as a basis for a momentum breakout. Strong momentum candles breaking outside of the Bollinger Bands can be interpreted as a momentum breakout coming from a market contraction phase.
Exponential Moving Averages Signals
One of the most popular ways traders identify potential trend reversals is based on the crossover of moving average lines. With the right parameters and when used in the right market condition, moving average crossover signals can be very effective.
Exponential Moving Averages Signals is based on this concept. It plots arrows whenever it detects its underlying moving average lines crossing over. The direction the arrow is pointing indicates the direction of the trend.
This indicator uses Exponential Moving Averages (EMA) because this type of moving average line tends to be very responsive to price movements, making it ideal for trend reversal signals.
Coppock Indicator
The Coppock indicator is a custom technical indicator used to help traders identify trend direction. It is an oscillator type of indicator which plots histogram bars to indicate trend direction.
This indicator plots histogram bars which oscillate around its median, zero. Positive bars indicate a bullish trend bias, while negative bars indicate a bearish trend bias.
Although its parameters can be modified to fit the trading style of the trader, it is naturally suited to indicate long-term trends.
Traders can use the shifting of the bars to positive or negative to indicate a possible trend reversal.
Traders can also use the indicator as trend direction filter to avoid taking trades that is going against the direction of the trend.
Trading Strategy
Coppock Momentum Trend Forex Trading Strategy is a trend following strategy which is initiated by a momentum breakout scenario.
The Bollinger Bands indicator is used to identify the momentum breakout. A strong momentum candle should break out of the Bollinger Bands to indicate a momentum breakout. Price action should stay on the half of the Bollinger Bands where the breakout has occurred, indicating that it is respecting the middle line as a dynamic support or resistance.
The Exponential Moving Average Signals should also plot an arrow pointing the direction of the probable trend reversal.
Then, the Coppock bars should shift over zero indicating that the trend has shifted in the direction of the trend.
Indicators:
- Bollinger Bands (default settings)
- ExponentialMovingAveragesSignals
- Faster EMA: 25
- Slower EMA: 30
- Coppock
- R Period1: 36
Preferred Time Frames: 30-minute, 1-hour and 4-hour charts
Currency Pairs: FX majors, minors and crosses
Trading Sessions: Tokyo, London and New York sessions
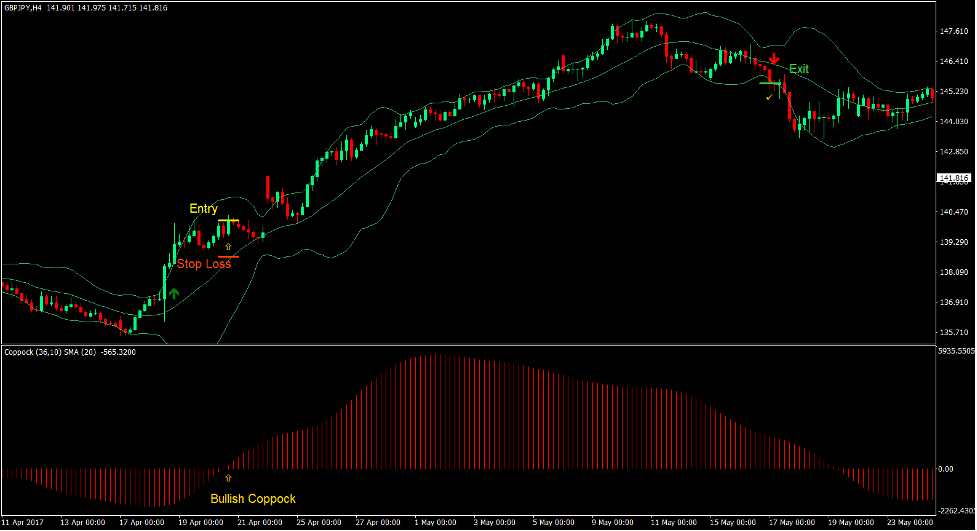
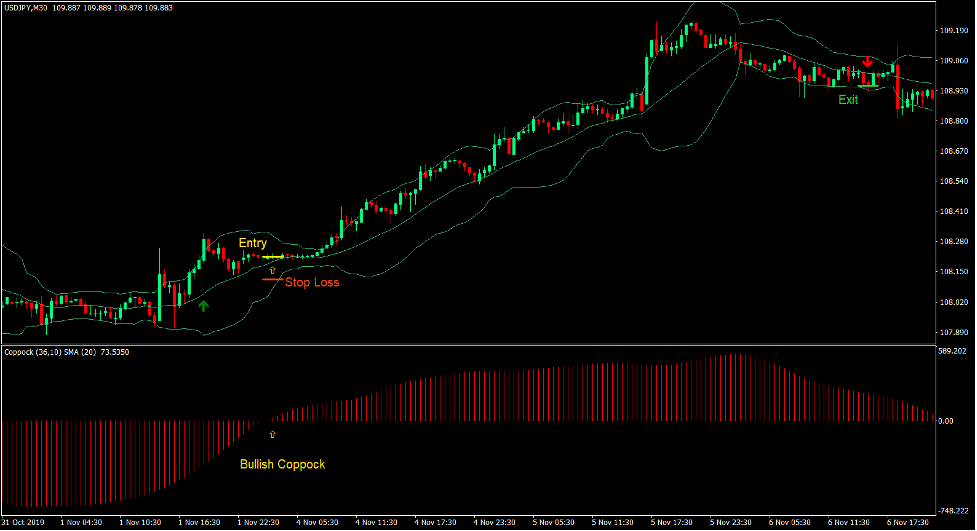
Buy Trade Setup
Entry
- A bullish momentum candle should break above the upper line of the Bollinger Bands.
- The Exponential Moving Averages Signals indicator should plot an arrow pointing up.
- The Coppock bars should shift above zero.
- Enter a buy order on the confirmation of these conditions.
Stop Loss
- Set the stop loss on a support below the entry candle.
Exit
- Close the trade as soon as a candle closes below the lower Bollinger Bands line.
- Close the trade as soon as the Exponential Moving Averages Signals indicator plots an arrow pointing down.
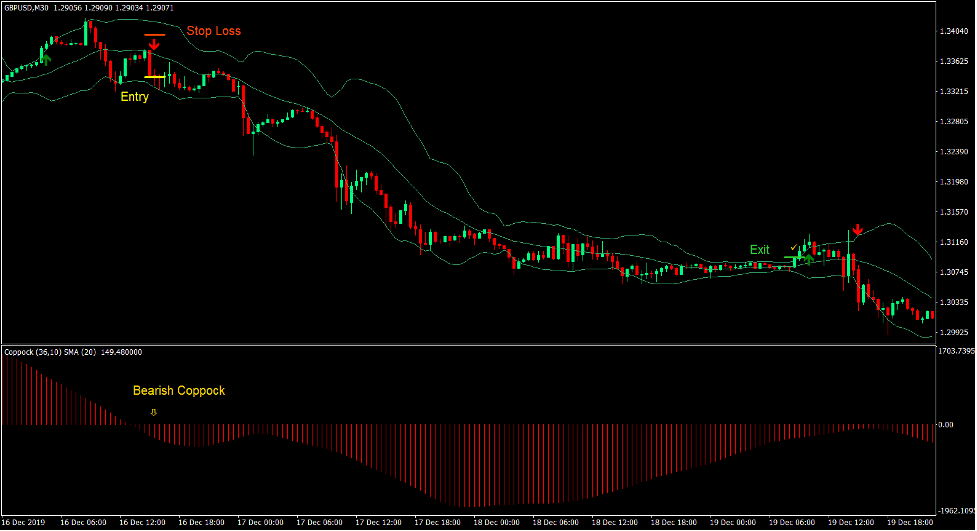
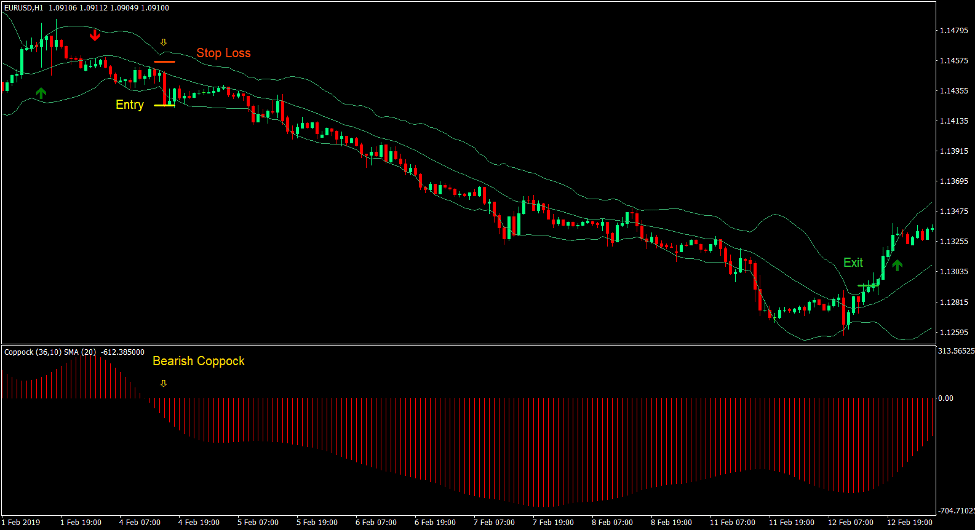
Sell Trade Setup
Entry
- A bearish momentum candle should break below the lower line of the Bollinger Bands.
- The Exponential Moving Averages Signals indicator should plot an arrow pointing down.
- The Coppock bars should shift below zero.
- Enter a sell order on the confirmation of these conditions.
Stop Loss
- Set the stop loss on a resistance above the entry candle.
Exit
- Close the trade as soon as a candle closes above the upper Bollinger Bands line.
- Close the trade as soon as the Exponential Moving Averages Signals indicator plots an arrow pointing down.
Conclusion
This trading strategy could produce trade setups with the potential to produce high yielding trades. This is because momentum breakouts could often result in a trending market condition.
However, the breakout candle itself does not mean that a trend reversal is imminent. There are many conditions that should be met. It could be the shifting in the direction of price action swings and retests of dynamic supports or resistances.
This trading strategy systematically confirms the trend reversal based on a set of rules, which allows traders to automatically enter trades without second guessing themselves.
Recommended MT4 Brokers
XM Broker
- Free $50 To Start Trading Instantly! (Withdraw-able Profit)
- Deposit Bonus up to $5,000
- Unlimited Loyalty Program
- Award Winning Forex Broker
- Additional Exclusive Bonuses Throughout The Year

>> Sign Up for XM Broker Account here <<
FBS Broker
- Trade 100 Bonus: Free $100 to kickstart your trading journey!
- 100% Deposit Bonus: Double your deposit up to $10,000 and trade with enhanced capital.
- Leverage up to 1:3000: Maximizing potential profits with one of the highest leverage options available.
- ‘Best Customer Service Broker Asia’ Award: Recognized excellence in customer support and service.
- Seasonal Promotions: Enjoy a variety of exclusive bonuses and promotional offers all year round.

>> Sign Up for FBS Broker Account here <<
Click here below to download: