


Trading is simple. Pick one of two options, up or down, buy or sell. If you could get it right, then you would earn some profit. If you are lucky, then you could be earning twice as much as you could lose on a stop loss or even more.
Worst case scenario should be a 50-50 chance of getting right since you are choosing between two options. Even if you just flipped a coin to decide whether to buy or to sell, you should be getting a 50% chance of getting it right. But traders are smart people, right? If you put some thought into it, then you should be increasing your chances of getting a win rather than losing. Some technical analysis should get you right more than 60% of the time, right?
Sadly, that is not the case. Many traders still fail to get it right despite having to choose between a buy or a sell. This is because traders do not only have to choose between the two options, they would also have to pick the right candle to enter the market. Now, you get to have so many options. The 50-50 chance just became a one in a hundred chance.
Data from brokers suggest that most traders get trade direction right most of the time. This means they usually pick the right option between a buy or a sell. The reason why most traders lose is because they are timing their entries and exits wrong.
CCI PRSI Magic Dots Forex Trading Strategy provides a way to precisely pick the right entry based on a confluence of technical indicators. It pinpoints specific entries and exits allowing traders to be more accurate.
PRSI PCCI Indicator
PRSI PCCI indicator is a custom oscillating indicator which detects momentum.
This indicator is based on the confluence of two prominent momentum indicators, the Relative Strength Index (RSI) and the Commodity Channel Index (CCI). The two indicators are converted into a percentage range. The percentage range of the RSI and the CCI are then displayed on one oscillating indicator window.
PRSI PCCI indicator is displayed using a line and histogram bars that oscillate from -55 to 55. Positive bars indicate an uptrend, while negative bars indicate a downtrend. The same applies with the line. A line that is crossing over zero indicates a bullish momentum, while a line that is crossing below zero indicates a bearish momentum.
MACD Dot
MACD Dot is a custom signal indicator based on the MACD.
The classic MACD is composed of a histogram and a line that oscillates around zero. The histogram is based on the difference between two moving averages, while the line is a Simple Moving Average line based on the histogram bars. Trade signals are typically generated whenever the bars and the line crossover.
This indicator marks trade signals by placing dots on the price chart. In this setup, a blue dot placed below a candle indicates a bullish momentum reversal, while an orange dot placed above a candle indicates a bearish momentum reversal.
Trading Strategy
This trading strategy produces trade signals based on the confluence of the PRSI PCCI indicator and the MACD Dot indicator, while being aligned with a long-term trend.
To identify the trend, we will be using a 200-period Exponential Moving Average (EMA). Trend direction would be based on the slope of the 200 EMA, as well as the location of price in relation to it. Trades are then filtered based on the 200 EMA trend.
As soon as we identify the trend direction, we will be looking for confluences between the PRSI PCCI indicator and the MACD Dot indicator.
The MACD Dot indicator should simply print a dot indicating the direction of the momentum reversal.
On the PRSI PCCI indicator, trade signals are generated whenever the bars and the line crossover zero in the direction of the trend.
These trade signals should be closely aligned as it would indicate a strong momentum. Reversals with weak momentum would typically not align as the signals are generated separately.
Indicators:
- macd-dot (default setting)
- PRSI_PCCI
- RSI Period: 28
- CCI Period: 28
- PRSI: 28
- PCCI Period: 28
Preferred Time Frames: 1-hour and 4-hour charts
Currency Pairs: major and minor pairs
Trading Sessions: Tokyo, London and New York sessions
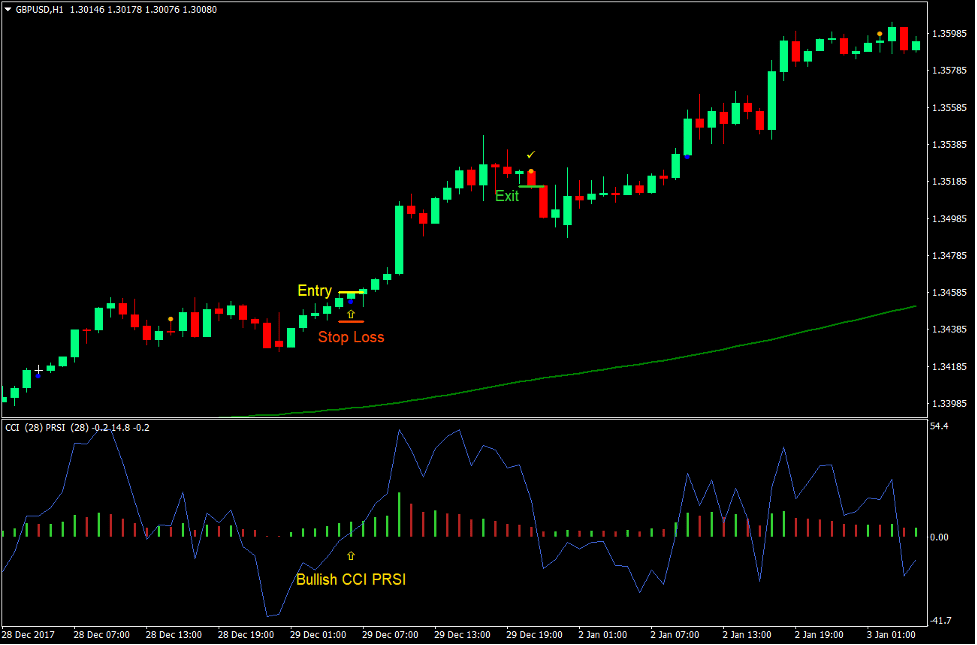
Buy Trade Setup
Entry
- Price should be above the 200 EMA line.
- The 200 EMA line should be sloping up.
- The PRSI PCCI bars and lines should cross above zero.
- The MACD Dot indicator should print a blue dot below price.
- These bullish signals should be closely aligned.
- Enter a buy order on the confirmation of these conditions.
Stop Loss
- Set the stop loss on the fractal below the entry candle.
Exit
- Close the trade as soon as an orange dot appears above price.
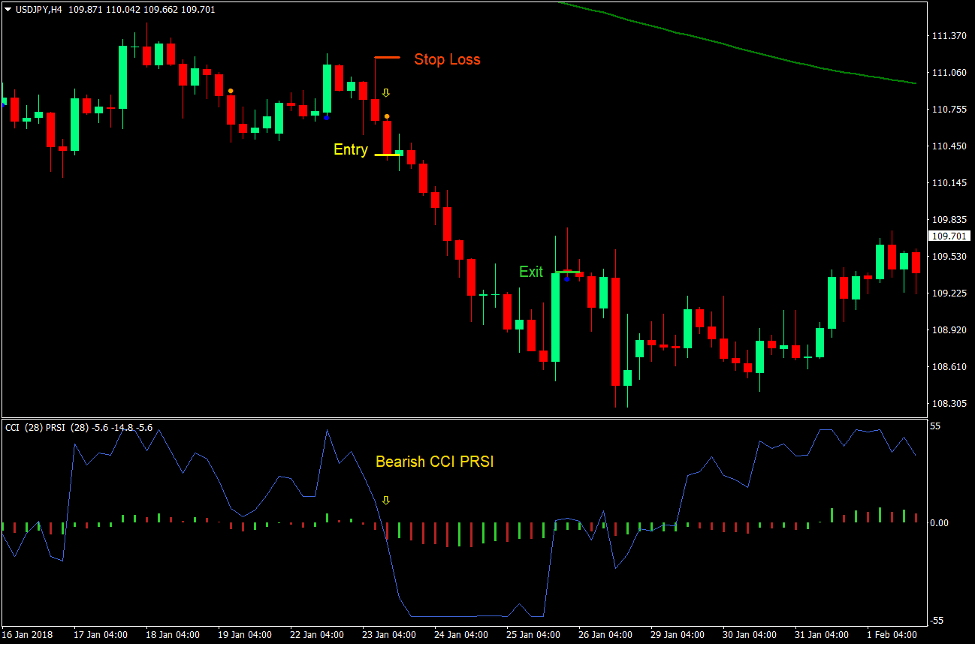
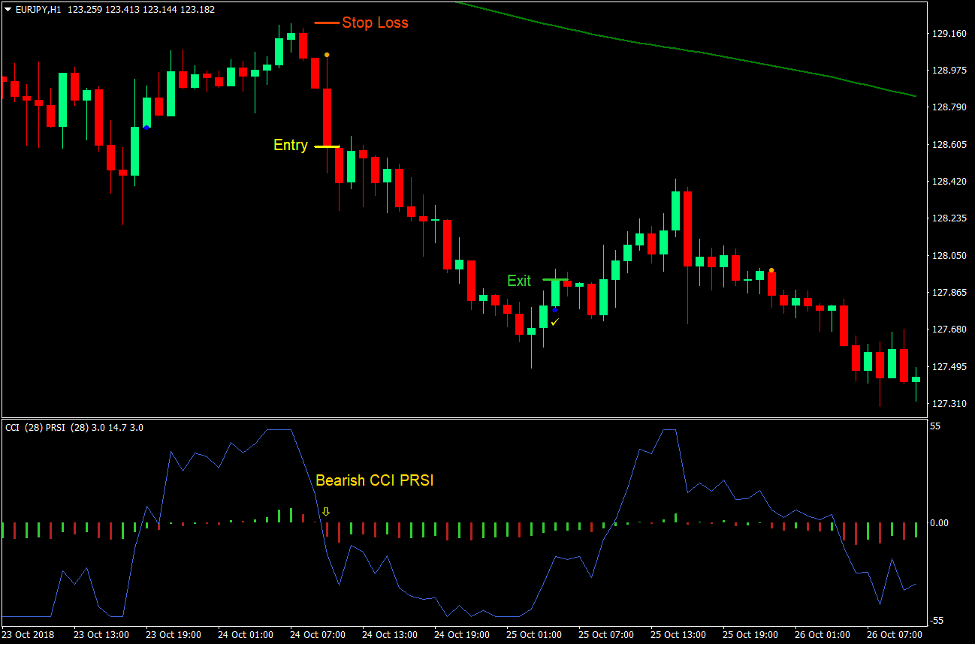
Sell Trade Setup
Entry
- Price should be below the 200 EMA line.
- The 200 EMA line should be sloping down.
- The PRSI PCCI bars and lines should cross below zero.
- The MACD Dot indicator should print an orange dot above price.
- These bearish signals should be closely aligned.
- Enter a sell order on the confirmation of these conditions.
Stop Loss
- Set the stop loss on the fractal above the entry candle.
Exit
- Close the trade as soon as a blue dot appears below price.
Conclusion
This type of strategy is a combination of a long-term trend following strategy that trades on deep retraces and a momentum reversal based on the indicators mentioned in this strategy.
Because of such combination, trade signals that are generated have a high chance of resulting in a profit.
Traders who are using this strategy should also learn to manage trades properly by trailing stop losses whenever possible. This is because the MACD is a lagging indicator. Although entry signals are accurate, exits would also be generated late. Profits could be wiped out if momentum reverses sharply. Trailing the stop loss will help mitigate it.
Recommended MT4 Brokers
XM Broker
- Free $50 To Start Trading Instantly! (Withdraw-able Profit)
- Deposit Bonus up to $5,000
- Unlimited Loyalty Program
- Award Winning Forex Broker
- Additional Exclusive Bonuses Throughout The Year

>> Sign Up for XM Broker Account here <<
FBS Broker
- Trade 100 Bonus: Free $100 to kickstart your trading journey!
- 100% Deposit Bonus: Double your deposit up to $10,000 and trade with enhanced capital.
- Leverage up to 1:3000: Maximizing potential profits with one of the highest leverage options available.
- ‘Best Customer Service Broker Asia’ Award: Recognized excellence in customer support and service.
- Seasonal Promotions: Enjoy a variety of exclusive bonuses and promotional offers all year round.

>> Sign Up for FBS Broker Account here <<
Click here below to download: