


Momentum strategies are one of the more popular types of strategies used by many traders. You would often see trading forums on popular forex trading websites discussing about various momentum trading strategies. Many professional traders also talk a lot about how they trade momentum.
This popularity is for a reason. Momentum trading strategies are simple, and it works. There are many traders who trade “Momo” type of strategies that have earned so much doing the same strategy every day. There is even a professional trader who have posted how he turned a few hundred dollars into more than a few hundred thousand dollars using the same momentum trading strategy.
The concept behind momentum is that price tends to move in the same direction whenever a strong price movement has occurred. This is the very essence of how momentum works even outside of trading, a large mass moving fast in one direction is very hard to stop. Step in front of it and you would be crushed. The same thing is true with trading. A large volume of transactions moving price in one direction is more likely to continue. Trade against it and you might regret it.
BvS Keltner Channel Momentum Forex Trading Strategy is a trading strategy based on one of the more popular types of momentum trading strategies. It uses custom indicators that are very reliable which could help traders profit consistently from the market.
Keltner Channel
The Keltner Channel is a technical indicator which could be used to identify volatility, trend and momentum.
It is composed of three lines. Its middle line is a basic Exponential Moving Average (EMA) of price. The outer lines are placed above and below the EMA line. Both lines are based on the Average True Range (ATR). The upper line is set two times the ATR above the EMA, while the lower line is set two times the ATR below the EMA line.
Because the Keltner Channel is based on an EMA line, it could also be used the same way as a classic moving average line is used. It could be used to identify trend based on where price is in relation to it, as well as the slope of the line.
The Keltner Channel is also a volatility indicator because the outer lines are based on the ATR. The bands expand and contract depending on volatility. This allows traders to identify a market contraction or an expansion phase.
Finally, the Keltner Channel identifies strong momentum price movements. Price moving two ATRs away from the average simply means that the market has suddenly had an influx of trading volume pushing price fast towards one direction. This is the very essence of momentum and the Keltner Channel allows traders to visually identify such scenarios.
Buyers vs Sellers Indicator
The Buyers vs Sellers indicator is a trend direction filter based on market sentiment.
This indicator compares the strength of the buyers versus the sellers. It then displays bars on a separate window indicating the direction of the trend. It displays lime bars to indicate a bullish market sentiment and red bars to indicate a bearish market sentiment.
This indicator could be used as a trend direction filter where traders could qualify trades based on the color of the bars. Traders could also use as an entry and exit trigger by taking trades based on the changing of the color of the bars. However, this should also be in confluence with other indicators.
Trading Strategy
This trading strategy is a simple momentum strategy based on the Keltner Channel and the Buyers vs Sellers indicator.
Many momentum strategies are based on a band or channel type of indicator. The Keltner Channel also works particularly well with a momentum strategy.
To qualify a strong momentum, a candle should close strongly beyond the upper or lower lines. A close above the upper line indicates a strong bullish momentum, while a close below the lower line indicates a strong bearish momentum. These candles should also have small wicks or no wicks at all to confirm that the candle closed with strong momentum.
The BvS indicator then confirms the trend direction based on the color of the bars it is printing. The color of the bars and the breakout of the candlesticks should confirm each other.
Indicators:
- Keltner_Chanel (default setting)
- BvS v3 (default setting)
Preferred Time Frames: 15-minute, 30-minute, 1-hour and 4-hour charts
Currency Pairs: major and minor pairs
Trading Sessions: Tokyo, London and New York sessions
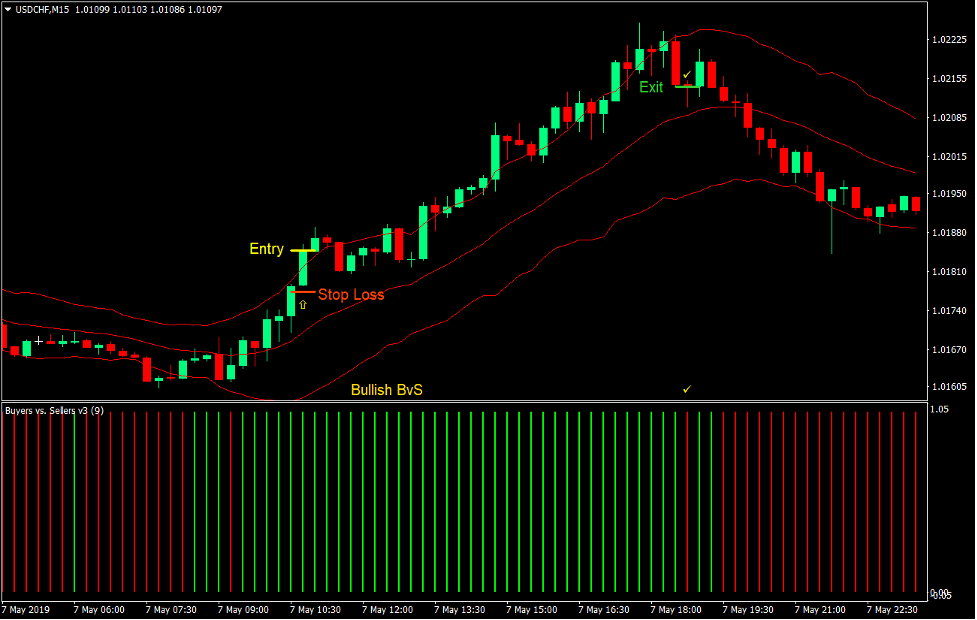
Buy Trade Setup
Entry
- The Buyers vs Sellers indicator should be printing lime bars.
- A bullish candle should close above the upper band of the Keltner Channel.
- The bullish candle should have small wicks and a long body.
- The breakout should be fresh.
- Enter a buy order on the confirmation of these conditions.
Stop Loss
- Set the stop loss below the low of the entry candle.
Exit
- Close the trade as soon as the Buyers vs Sellers indicator prints a red bar.
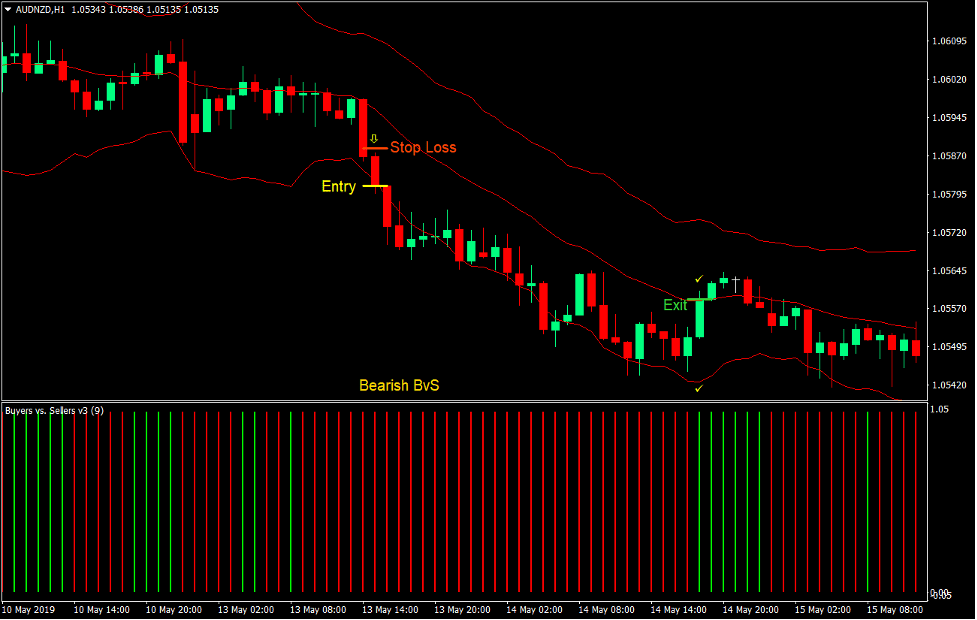
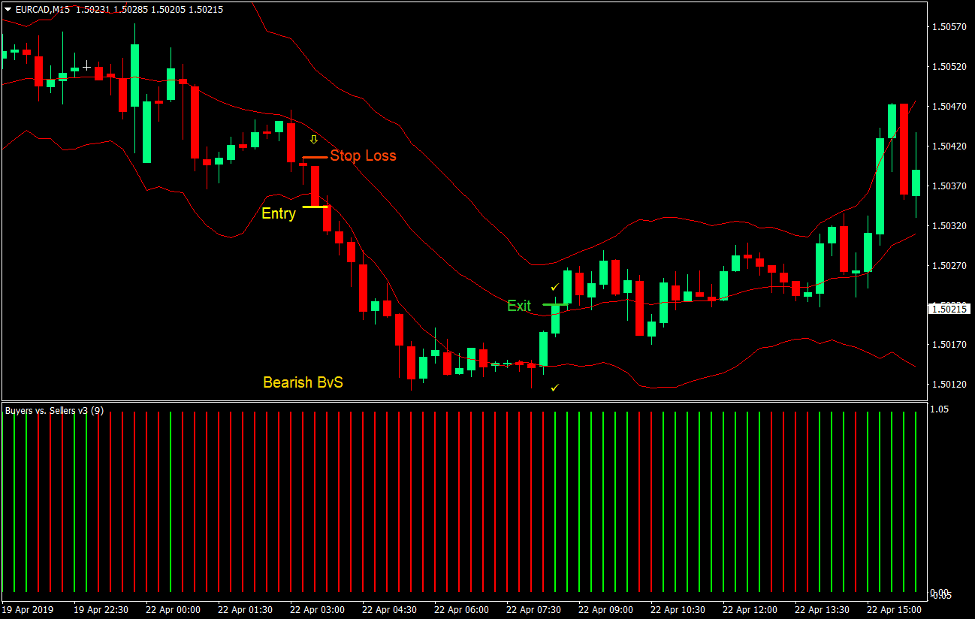
Sell Trade Setup
Entry
- The Buyers vs Sellers indicator should be printing red bars.
- A bearish candle should close below the lower band of the Keltner Channel.
- The bearish candle should have small wicks and a long body.
- The breakout should be fresh.
- Enter a sell order on the confirmation of these conditions.
Stop Loss
- Set the stop loss above the high of the entry candle.
Exit
- Close the trade as soon as the Buyers vs Sellers indicator prints a lime bar.
Conclusion
This trading strategy is a working trading strategy.
This type of strategy works well when aligned with a higher timeframe trend. It also tends to work well on a breakout after a contraction phase. However, there are also cases wherein the breakout would occur right after price retraces towards the midline. This trade setup also tends to work well because the market is in a trending condition.
Not all trades would work out. There are cases wherein price would reverse almost instantly after a strong bullish breakout. This often occurs when the candle is exceptionally long and is too far from the mean.
Practice this strategy and learn to manage trades well as price moves in your favor. Master this and you could be earning consistently from the market.
Recommended MT4 Brokers
XM Broker
- Free $50 To Start Trading Instantly! (Withdraw-able Profit)
- Deposit Bonus up to $5,000
- Unlimited Loyalty Program
- Award Winning Forex Broker
- Additional Exclusive Bonuses Throughout The Year

>> Sign Up for XM Broker Account here <<
FBS Broker
- Trade 100 Bonus: Free $100 to kickstart your trading journey!
- 100% Deposit Bonus: Double your deposit up to $10,000 and trade with enhanced capital.
- Leverage up to 1:3000: Maximizing potential profits with one of the highest leverage options available.
- ‘Best Customer Service Broker Asia’ Award: Recognized excellence in customer support and service.
- Seasonal Promotions: Enjoy a variety of exclusive bonuses and promotional offers all year round.

>> Sign Up for FBS Broker Account here <<
Click here below to download: